 (1).png)
While the consensus long-term outlook remains bullish for India, discomfort around broader valuations seems to be rising as the divergence between ‘Numbers’ and ‘Narratives’ seems to be widening.
The famous investor, “Sir John Templeton’ once said that the most dangerous narrative in the world of equities is that ‘This time it is different’. We get to hear this narrative so often and, in fact, one may consider it a key narrative to avoid when the underlying theme is that ‘this time it is different’. In the world of investments, the more things change the more they remain the same. Things do change but never as drastically as narratives make it out to be!
Nonetheless, in order to identify the divergence, one needs to first get a good perspective of the key beliefs, illusions and delusions of both the ‘Numbers Person’ and the ‘Narrative person’. We relate to and remember stories better than we do numbers, but storytelling can lead us to fantasy land quickly, a problem in investing. Numbers allow us to be disciplined in our assessments, but without stories behind them, they become weapons of intimidation and bias rather than discipline. The solution is simple. One needs to bring both stories and numbers into play in investing and business, and valuation is the bridge between the two.
In this newsletter, we attempt to summarize some of the key learnings and frameworks from Prof. Aswath Damodaran’s book “Narrative and Numbers – The value of stories in Business”
1) Understanding the duelling perspectives between ‘Narratives Person’ and ‘Numbers Person’,
2) Frameworks to identify false narratives and
3) Discussion on how to deal when the toughest narrative – Go Big the Macro narrative, which seems to be in play in India.
1) Constant Duelling Perspective between ‘Numbers Person’ vs ‘Narrative Person’
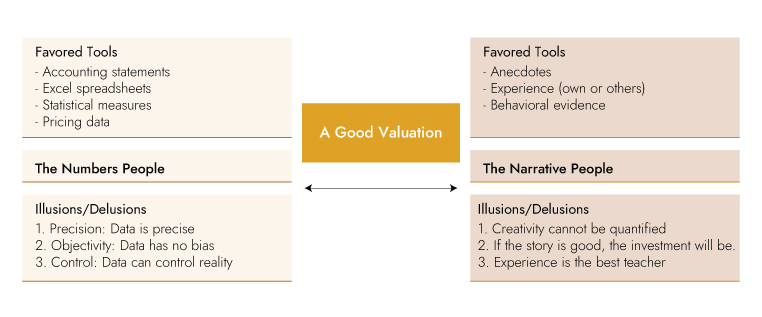
Numbers people believe that valuation should be about numbers and that narratives/stories are distractions that bring in irrationalities into investing. While Narratives people believe that valuation and investing is about great stories and that it is the height of hubris to try to estimate numbers when you face uncertainty. Numbers and narratives people speak different languages and and often do not understand what the other side is saying. Each side thinks that it occupies the high ground and believes in the worst caricatures it can of the other side. Successful valuation exercise should aim to act as a bridge between the two.
To make the link between stories and value, one needs to focus on intrinsic valuations. The intrinsic value of a company is based upon its fundamentals: cash flows, expected growth and risk. It allows one to convert the words in stories into inputs in valuations. This transparency enables a valuable feedback loop. The ordinary investors hold on to their narrative and keep it unchanged, even in the face of contradictions. Whereas, successful investors are able to incorporate the breaks, changes and shifts in their narrative to update their company value. Prof. Aswath Damodaran in his famous book “Narrative and Numbers – The value of stories in Business” starts by sharing a question – “What comes naturally to you, storytelling or number crunching.” He goes on to argue that most investors knowingly or unknowingly lean more towards one type of investing. He shares a few simple tests in his books, which can help reveal an investors leaning.
Illustrative Simple Trial - What comes naturally to you, storytelling or number crunching?
In his book, he presents the simple test in the form a valuation exercise for the legendary luxury automaker Ferrari’s IPO and asks readers to ask themselves which one of these approaches they identify with. Prof. Damodaran opines that we can become better investors and can avoid big mistakes if we start working on the side of the brain which we have left dormant for long.
Valuations - Bridging the Gap
Stories without numbers are little more than fairy tales. Numbers without stories are exercises in financial modelling. A good valuation is a bridge which will draw on both the numbers and the stories to come up with a figure that makes sense. "In effect, valuation allows each side to draw on the other, forcing storytellers to see the parts of their stories that are improbable or implausible, and to fix them, and number crunchers to recognize when their numbers generate a story line that does not make sense or is not credible." – Aswath Damodaran
Exhibit 1: Good valuation is a bridge between Narrative and Numbers
Source: Prof. Aswath Damodaran’s book “Narrative and Numbers – The value of stories in Business”
Exhibit 2: The Approach and Delusions of ‘Numbers Person’ and ‘Narrative Person’

Source: Prof. Aswath Damodaran’s book “Narrative and Numbers – The value of stories in Business
Scientific research proves the same - Left Brain vs Right Brain
Scientific studies have also documented that our brain has two halves and they process information very differently. The theory that you are either ‘Left brained’ or ‘Right brained’ suggests that one side of the brain is dominant. This suggests that the left brain is more verbal, analytical and orderly than the right brain. It’s sometimes called the digital brain because it’s better at things like reading, writing and computations. On the other hand, the right brain is more visual, intuitive and creative. This theory is based on the fact that the brain’s two hemispheres function differently. This first came to light in the 1960s thanks to the research of psychobiologist and Nobel Prize winner, Roger W. Sperry.
Exhibit 3: Source: Prof. Aswath Damodaran’s book “Narrative and Numbers – The value of stories in Business” Different styles of thinking (Left Brain vs Right Brain)?
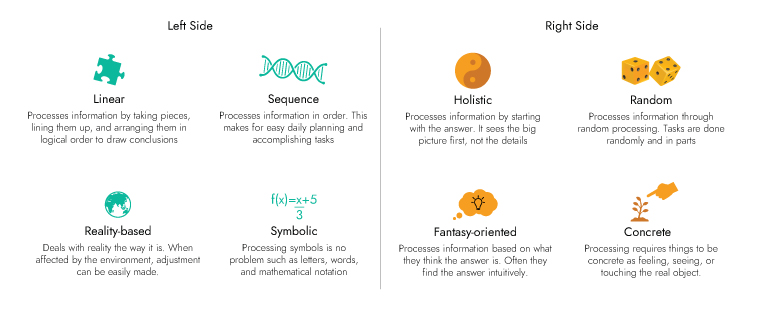
Source: Prof. Aswath Damodaran’s book “Narrative and Numbers – The value of stories in Business”
Exhibit 4: Left Brain” vs “Right Brain”
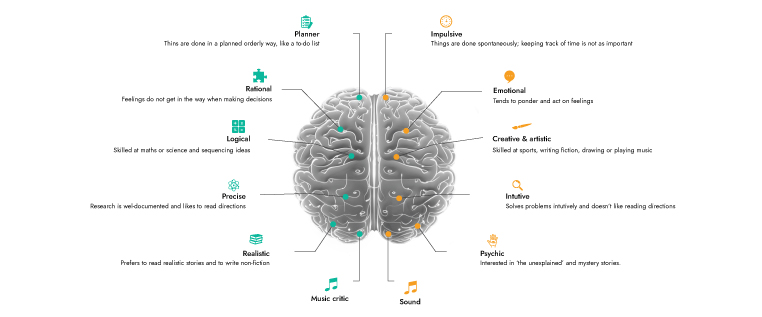
Source: Prof. Aswath Damodaran’s book “Narrative and Numbers – The value of stories in Business”
2) Framework to identify improbable Stories/ Narratives
A. The Iron Triangle of Valuation
During bull markets there is a tendency of narratives taking over numbers. Unlike fictional stories where one is bounded only by one’s own imagination, a business story needs to be grounded in reality. The iron triangle of valuation is an effective tool to screen false narratives. The three corners of triangle – Growth, Risk and Reinvestment – are the drivers of the value of business. For each variable, the effect on the value of the business is predictable.
As Growth increases, value will go up. However, as Risk or Reinvestment increases, value will go down. Not surprisingly, a storyteller with an agenda of making a company more valuable will tell a story that combines high growth with low risk and low reinvestment, but that story is usually implausible because it is inconsistent. A company with high growth will generally need to have reinvestment to deliver that growth, which will make it riskier than average much of the time.
Exhibit 5: The iron triangle of valuation
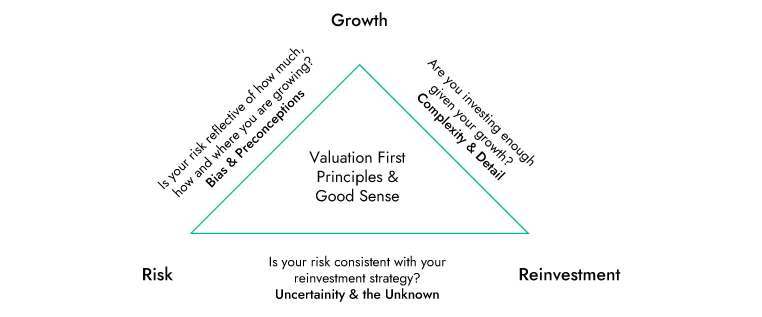
Source: Prof. Aswath Damodaran’s book “Narrative and Numbers – The value of stories in Business”
B. Check the Narrative against History, Economic First Principles and Common Sense
Estimation versus Economic uncertainty
- Estimation uncertainty reflects the possibility that you could have the ‘wrong model’ or estimated inputs incorrectly within the model.
- Economic uncertainty comes from the fact that markets and economies can change over time and that even the best models will fail to capture these unexpected changes.
Micro uncertainty vs Macro uncertainty
- Micro uncertainty refers to uncertainty about the potential market for a firms products, the competition it will face and the quality of its management team.
- Macro uncertainty reflects the reality that your firm’s fortunes can be affected by changes in the macro-economic environment.
Discrete versus continuous uncertainty
- Discrete Risk: Risks that lie dormant for periods but show up at points in time.
Examples: A drug working its way through FDA pipeline may fail at some stage of the approval process or a company in Venezuela may be nationalized.
- Continuous risk: Changes in interest rates or economic growth occur continuously and affect value as they happen.
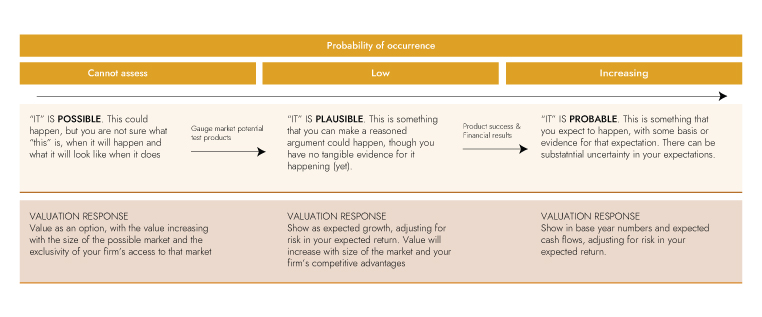
C.The Three P’s: Possible, Plausible and Probable
Any narrative has to pass through the following three P’s.
- The first test for any story/narrative is to make sure it is possible. Many stories fail this simple test as they are founded on business fairy tale.
- The second test is determining whether the story is Plausible. For a story to be plausible, one needs some evidence that it can happen.
- The third test is the toughest and needs determining if the story is probable, which needs one to quantify the story and make estimates of how the story will play out in numbers.
Exhibit 6: The Three P’s Test: Is it Possible, Plausible and Probable?
Source: Prof. Aswath Damodaran’s book “Narrative and Numbers – The value of stories in Business”
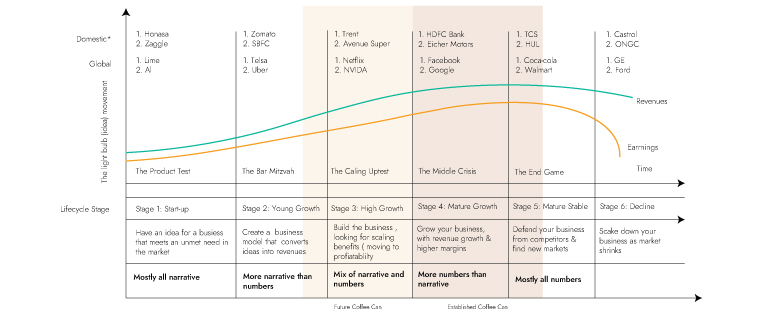
D. Life Cycle Test
Corporates, like human beings, go through a life cycle journey in six stages - from an Infant (Start-up) to Old Age (Declining). The exhibit below illustrates this journey along with a description of characteristics exhibited by companies during these varied phases.
During Stage 1-2, when all a company has is ideas and often no clear business plan, it is largely about narrative. During such phases the most successful managers and investors are people who are strong on narrative. As companies age and move to Stage 3 and ahead, the narrative shifts to Numbers, partly because the narrative that has actually unfolded determines more of the value and partly because there is more numbers to focus on. The most successful managers/investors become people who are stronger on numbers.
One of the most common mistakes investors make is focus on buying narrative stories for companies from stage 3 and 5, and often compulsively focus on numbers for companies which are still in stage 1 to 2.
Exhibit 7: Life cycle analysis
Source: Professor Aswath Damodaran (The Corporate Life Cycle: Growing up is hard to do, Growing old is even harder) / * Ambit Asset Management
The challenges of Macro Narrative
Macro storytelling is trickier than micro storytelling. In micro story, one starts with a company and while considering the company one also evaluates the market and the competitive landscape. It is the company which is the focus. Nonetheless, this may not work when the investment is being driven primarily by the macro variables over which one has little control. Such narratives can centre around commodities, interest rates or on countries.
This is a more difficult scenario as macro variables are driven by forces which are both complicated and global. Small changes in one part of the world can cause unexpected shifts in variables. But for deep cyclical companies, commodity companies or country/region (example: China/Emerging Markets story), one may have no other choice. In recent years, a new strand of macro investing has become common, in which investors forecast upcoming trends and try to invest in companies based on those forecasts. We have in recent times witnessed such investment style through proliferation of thematic funds in India.
When valuations are driven by macro factors, rather than micro, there are three consequences for investors that are worth keeping in mind:
Firstly – macro cycles like commodities tend to be long-term with upswings and downswings that can last for decades.
Secondly – macro variables are more difficult to predict using fundamentals compared to micro. This makes forecasting very difficult.
Thirdly – structural shifts in the process can cause breaks from the past and render history moot.
For such situations Prof. Damodaran recommends that despite these narratives render micro valuations difficult one should break down the narrative into micro and macro so that one is aware how much of investment judgement/view is coming from views on the company and how much from the macro factors. India currently seems to be enjoying the benefits of a very strong Macro Narrative.
Summary
- While the long term macro story for India continues to remain strong and is a decadal theme; there seem to be sectoral pockets, where the narrative and number divergence seem very high and the overall story seems implausible.
- To meet our objective to make manufacturing as percentage of GDP to 25%, government needs to sustain its bold reforms and capex momentum, to kick start private sector capex.
- India today seems to be enjoying from some form of strong macro country narrative. As discussed, unlike micro narratives, macro narratives are more challenging and complicated. As these trends can last decades, is difficult to predict using fundamentals and structural shifts in process can cause breaks from past rendering history moot. We believe, investors will do well to heed to Prof. Aswath Damodaran recommendations to deal with such scenarios. Dissecting company value into micro (intrinsic value) and that coming from macro tailwind, will allow investors to concentrate on micro driven stories and avoid companies/ sectors, which are riding primarily on the macro tailwind.
- Macro narratives driven pockets of the market are looking increasingly vulnerable. We believe, a bottom up ‘Quality Investing Focus’ and ‘Long-term Investment Mindset’, can enable investors to navigate this period better. Furthermore, at this juncture the focus of investors should shift from returns maximization to capital preservation and quality investing style. Hence, we expect the markets to increasingly become more selective and a stock pickers market.
Exhibit 8: Key macro narratives and numbers for India
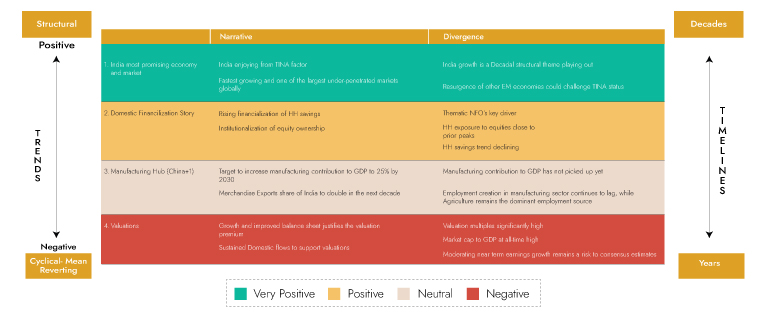
Source: Ambit Asset Management
1. India one of the most promising economy and market
Exhibit 9: India is one of the fastest growing and on a structural long term growth phase
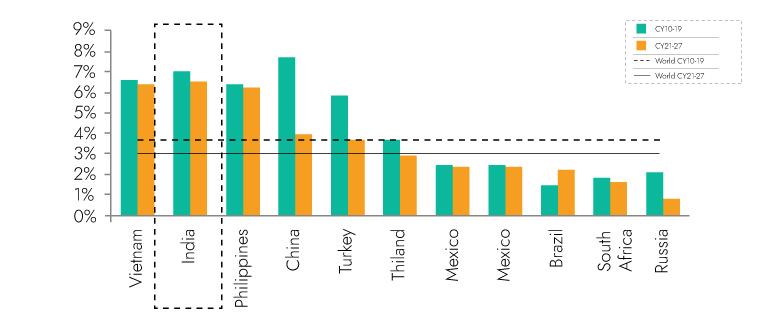
Source:World bank, IMF, Ambit Asset Management
Exhibit 10: …and poised to emerge as the third largest economy by CY27
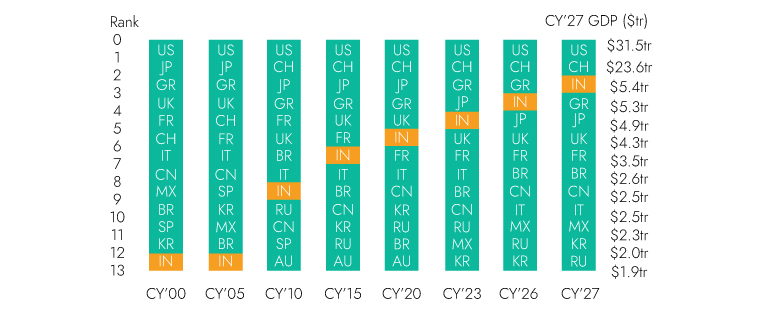
Source:CMIE, Ambit Asset Management
Exhibit 11: India M3 money supply has been stagnant since FY19
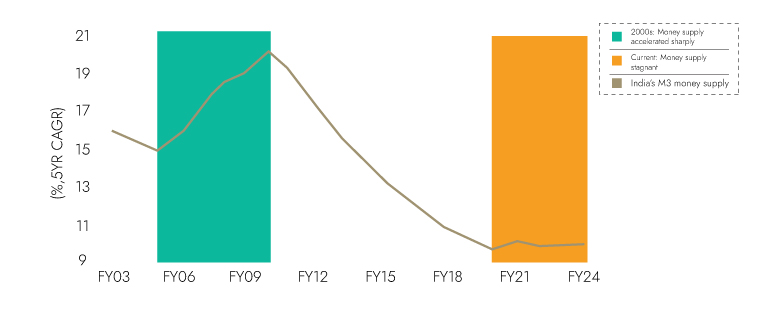
Source:CMIE, Nuvama Research, Ambit Asset Management
Exhibit 12: PAT growth driven by margin expansion, while topline growth has been muted
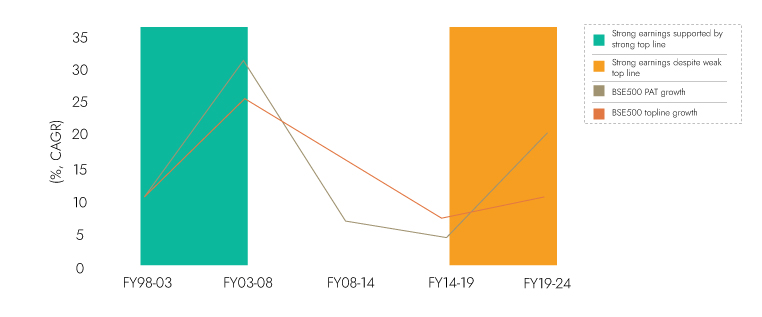
Source:CMIE, Nuvama Research, Ambit Asset Management
Unlike past bull phase in FY03-07, when equity market boom was accompanied by economic buoyancy, this time here has been a divergence. If one looks at growth trendline pre COVID we are still 9% below that on nominal terms The key positive of the current bull rally has been strong FCF generation and balance sheet deleveraging by corporates. Though ROE is lower compared to FY03-07 bull market phase. BSE500 (ex-BFSI) free cash flow to sales Asset Management
Exhibit 13: Last bull cycle equity was accompanied by economic buoyancy
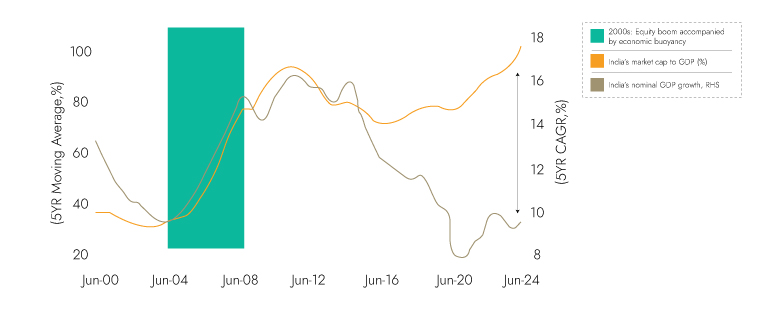
Source: CMIE, Nuvama Research, Ambit Asset Management
Exhibit 14: India nominal GDP well below pre-COVID trend...
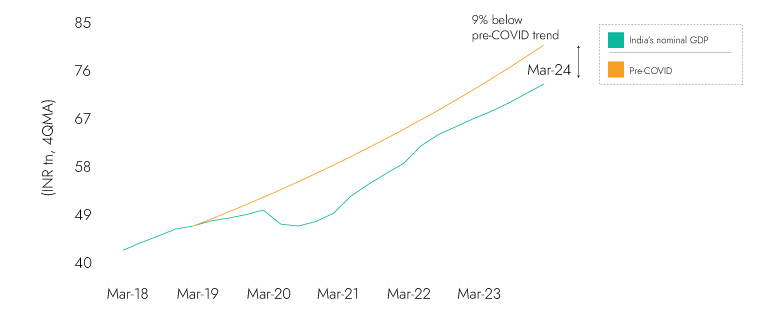
Source: CMIE, Nuvama Research, Ambit Asset Management
The key positive of the current bull rally has been strong FCF generation and balance sheet deleveraging by corporates. Though ROE is lower compared to FY03-07 bull market phase
Exhibit 15: Free cash flow profile better than 2007..
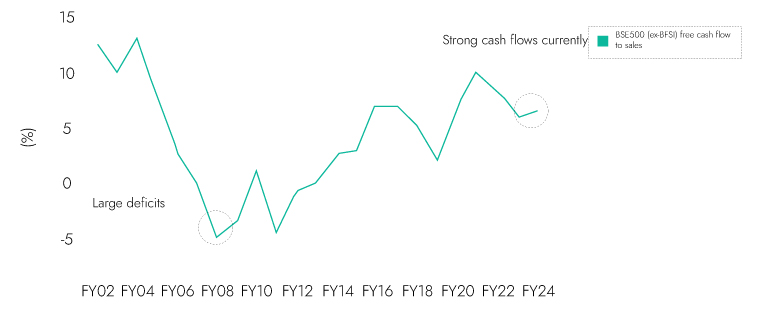
Source: Capitaline, Nuvama Research, Ambit Asset Management
Exhibit 16: BSE500 RoE (RHS) But RoE’s are much lower
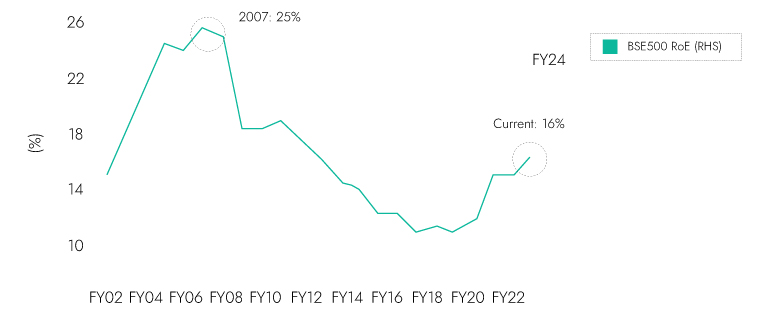
Source: Capitaline, Nuvama Research, Ambit Asset Management
Post COVID economic recovery has been K shaped across sectors
Exhibit 17: Real estates sales show uneven recovey in top 10 metros
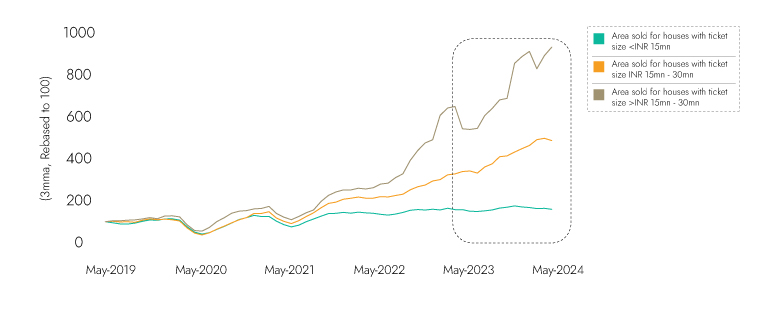
Source: CMIE, Nuvama Research, Ambit Asset Management
Exhibit 18: Autos have seen two track recovery this time unlike 2000’s bull market
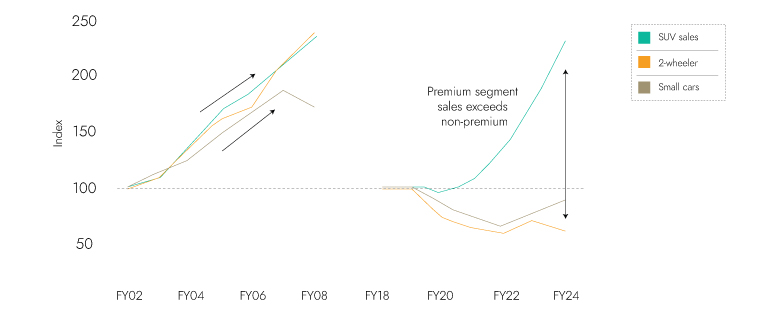
Source: CMIE, Nuvama Research, Ambit Asset Management
Exhibit 19: Cement volumes remains weak
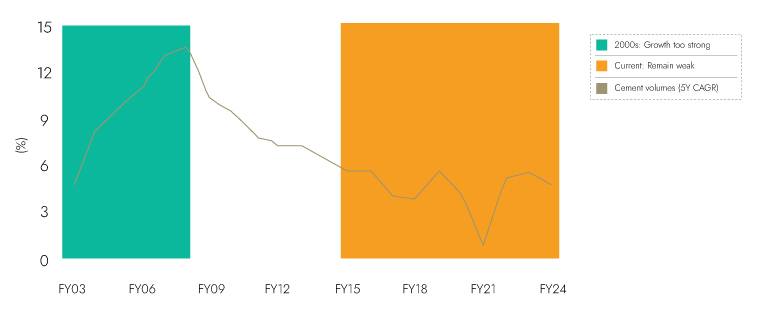
Source: CMIE, Nuvama Research, Ambit Asset Management
Exhibit 20: MHCV volumes too remain weak
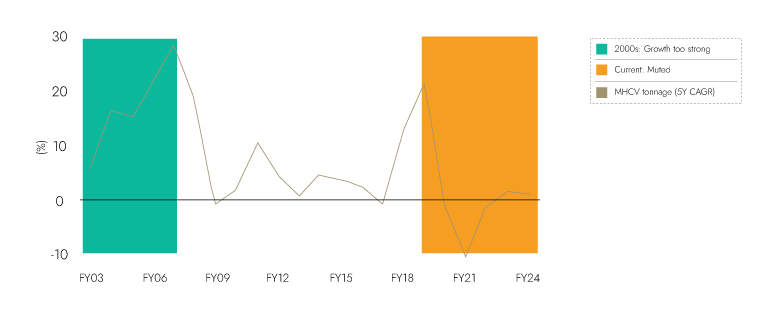
Source: CMIE, Nuvama Research, Ambit Asset Management
B. Domestic Finalization Story
Exhibit 21: Domestic equity ownership is increasing
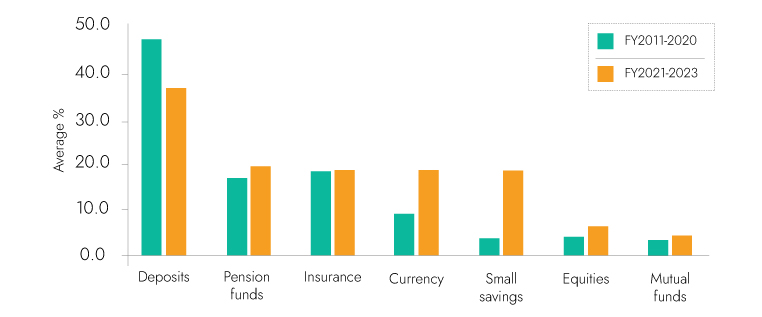
Source: RBI, NSO, Ambit Asset Management
Exhibit 22: Domestic flows have mitigated weak FII flows
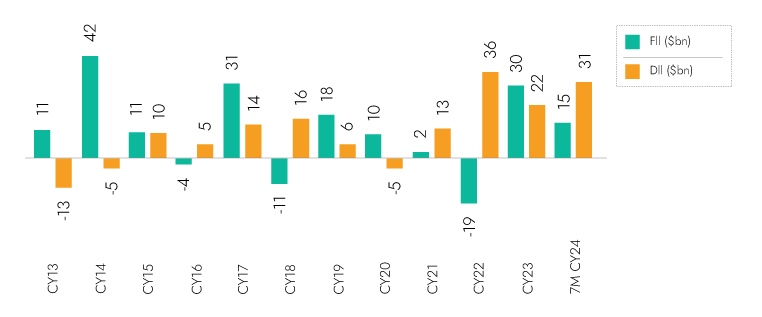
Source: AMFI, Avendus Spark Research, Ambit Asset Management
HH flows as % to GDP though is still lower than FY08 peak. In recent times MF NFO’s have been the key MF AUM driver
Exhibit 23: Domestic flows were strong in 2007 and are strong now as well
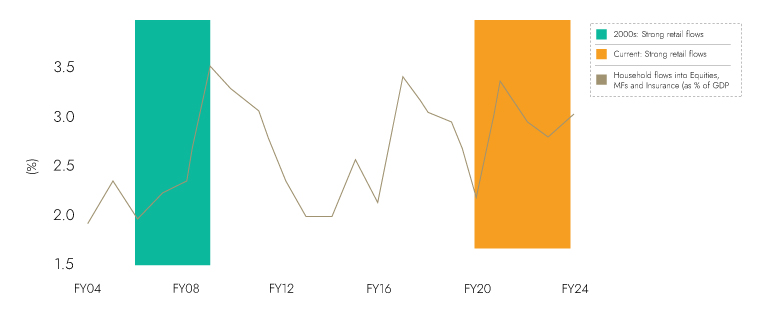
Source: CMIE, Nuvama Research, Ambit Asset Management
Exhibit 24 : Large numer of Thematic NFOs launched and funds raised in 7MCY24
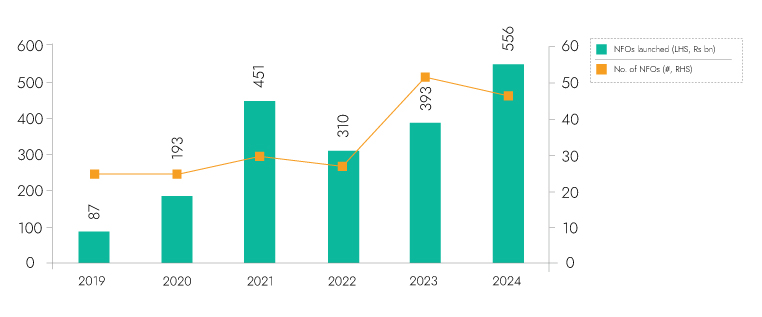
Source: AMFI, Avendus Spark Research, Ambit Asset Management
HH flows as % to GDP though is still lower than FY08 peak. In recent times MF NFO’s have been the key MF AUM driver
Exhibit 25: Sharp increase in AUM of small-cap and thematic funds
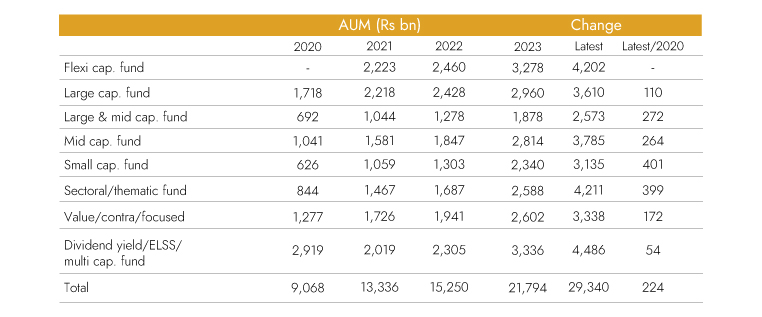
Source: AMFI, Kotak Institutional Equities, Ambit Asset Management
Exhibit 26: Net SIP flows remains flat, April 2022 - July 2024 (Rs bn)
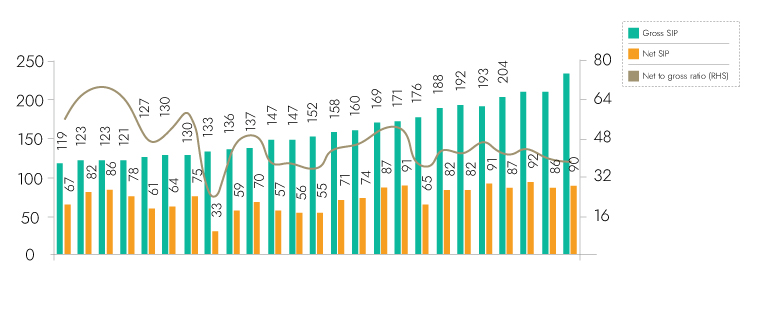
Source: AMFI, Kotak Institutional Equities, Ambit Asset Management
3. Emerging as Manufacturing Hub
Post COVID economic recovery has been K shaped across sectors
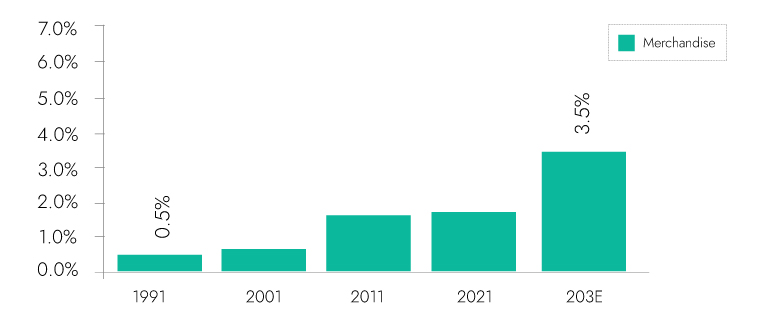
Exhibit 27: Merchandise exports as a % of world
Source: IBEF, Ambit Asset Management
Exhibit 28: Manufacturing as % of total GVA remains weak
Source: CMIE, Nuvama Research, Ambit Asset Management
Exhibit 29: Post-pandemic growth in GFCF has been driven by real estate investments by households; private corporate capex yet to pick up meaningfully.
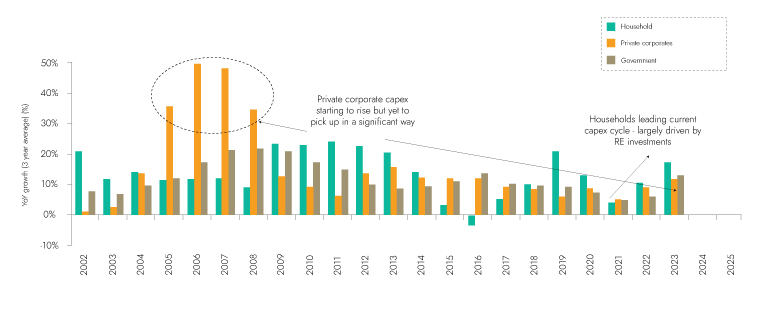
Exhibit 30: Agriculture remains dominant employer of workforce
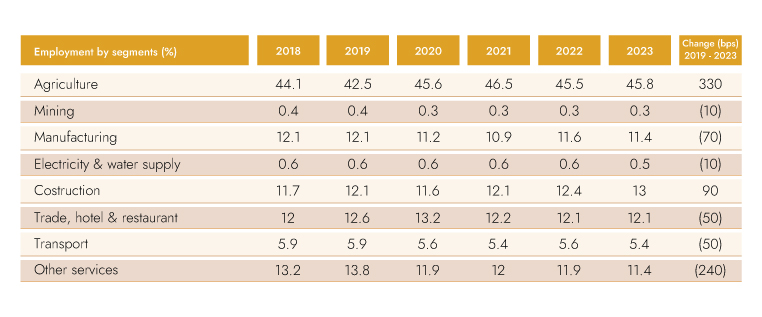
Source: PLFS, Ambit Asset Management
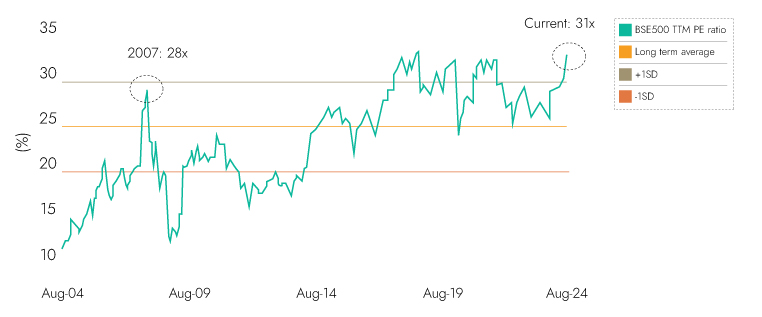
4. Valuations
Valuations across the board are at all-time highs. Current bull market has been on back of lower ROE and higher interest rates
Exhibit 31: Valuations close to all time high on price to earnings basis
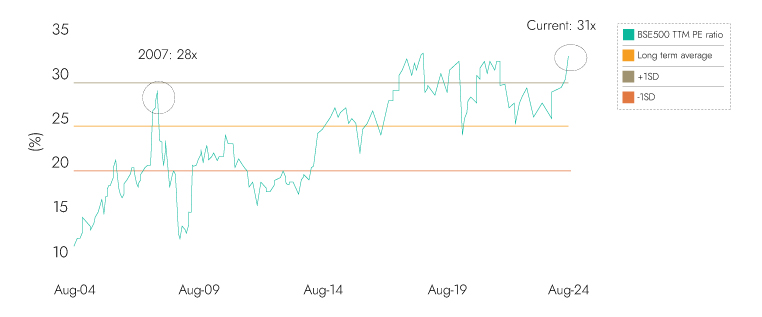
Source: Bloomberg, Nuvama Research, Ambit Asset Management
Exhibit 32: Median price to book is very high for a much lower ROE
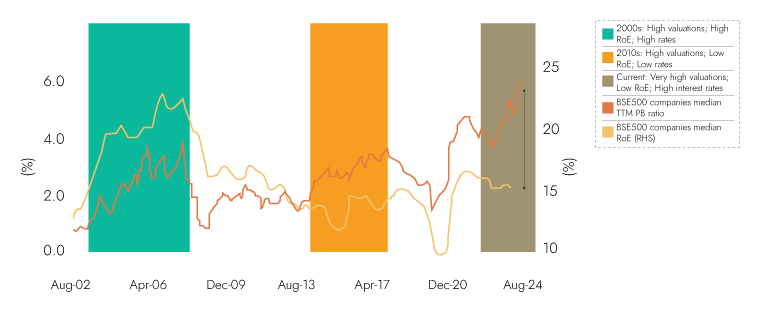
Source: Bloomberg, Nuvama Research, Ambit Asset Management
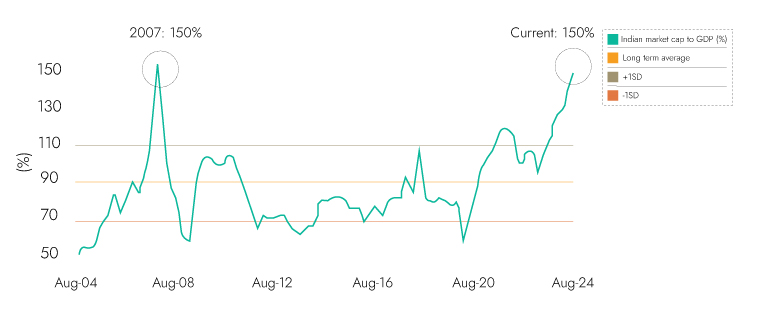
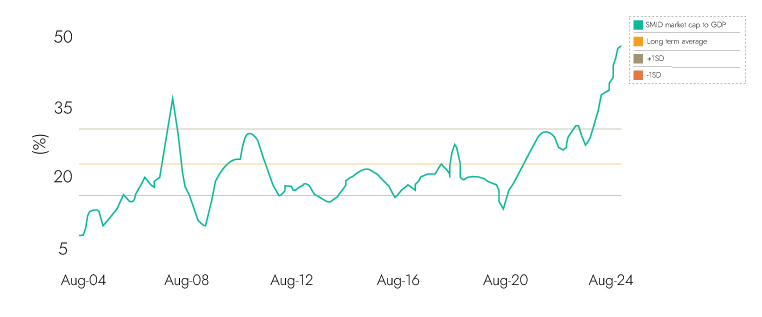
Market cap to GDP is currently at all time highs, while the SMID contribution to overall Mcap is also at all time high
Exhibit 33: Market cap to GDP at historic high
Source: Bloomberg, Nuvama Research, Ambit Asset Managemen
Exhibit 34: SMID valuations are exorbitant
Source: Bloomberg, Nuvama Research, Ambit Asset Management
Valuation premium visible across
Exhibit 35: ...on PE basis, its significantly higher
Source: Bloomberg, Nuvama Research, Ambit Asset Management
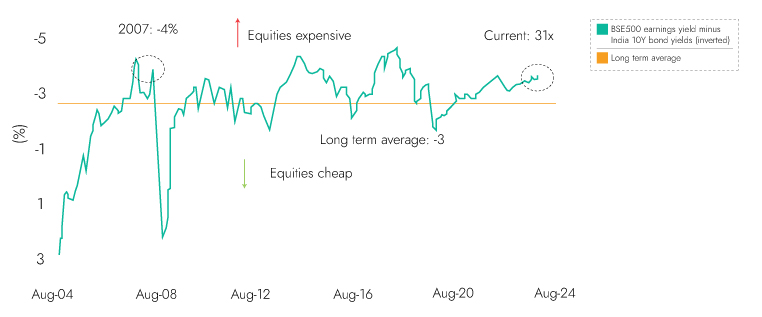
Exhibit 36: India’s valuation is expensive relative to bond yields...
Source: Bloomberg, Nuvama Research, Ambit Asset Management
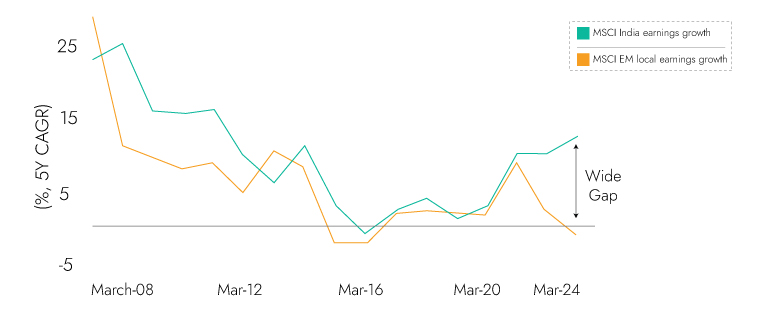
India’s SMID premium to MSCI and other markets at record high
Exhibit 37: India has outpaced EM earnings post COVID...
Source: Bloomberg, Nuvama Research, Ambit Asset Management
Exhibit 38 ...and it’s balance sheet is also better
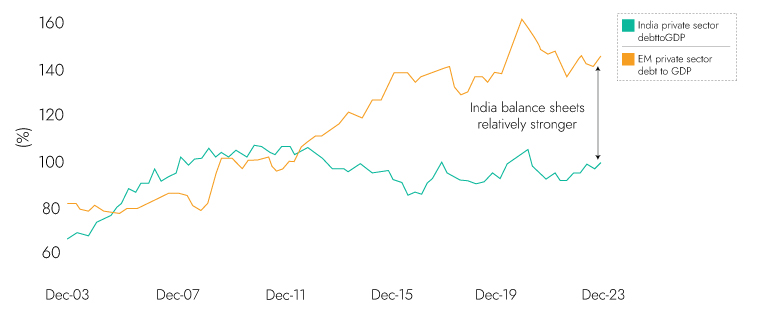
Source: Bloomberg, Nuvama Research, Ambit Asset Management
Though India stands out on Earnings growth and balance sheet deleveraging
Exhibit 39: India’s PE premium to MSCI EM at all time high
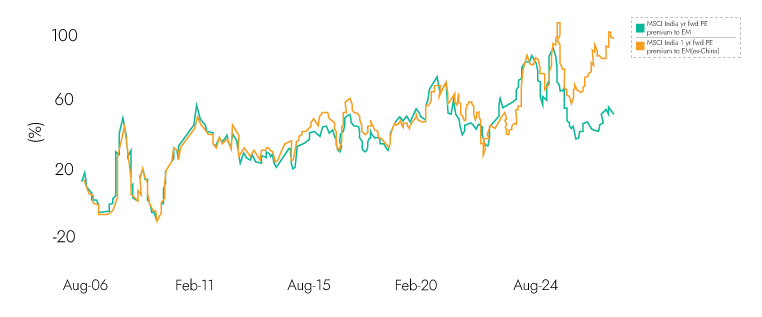
Source: Bloomberg, Nuvama Research, Ambit Asset Management
Exhibit 40: Midcap index significantly outperformed its global peers
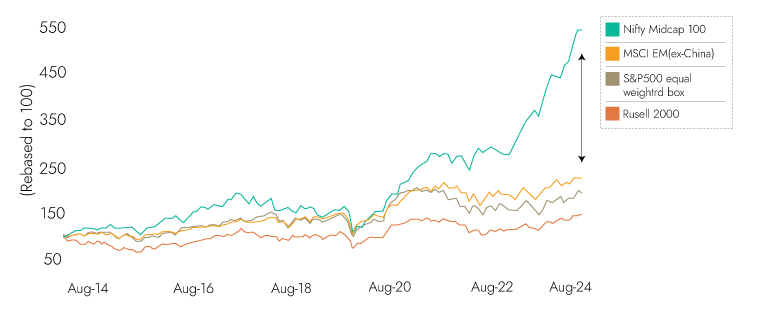
Source: Bloomberg, Nuvama Research, Ambit Asset Management
Higher the valuation entry point the lower the long term expected returns
Exhibit 41: Starting valuations determine medium term returns
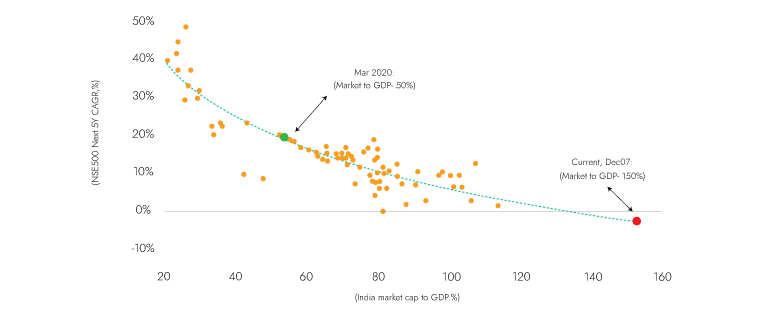
Source: Bloomberg, Nuvama Research, Ambit Asset Management
AMBIT COFFEE CAN PORTFOLIO
At Coffee Can Portfolio, we do not attempt to time commodity/investment cycles or political outcomes and prefer resilient franchises in the retail and consumption-oriented sectors. The Coffee Can philosophy has an unwavering commitment to companies that have consistently sustained their competitive advantages in core businesses despite being faced with disruptions at regular intervals. As the industry evolves or is faced with disruptions, these competitive advantages enable such companies to grow their market shares and deliver long-term earnings growth.
Exhibit 42: Ambit’s Coffee Can Portfolio point-to-point performance
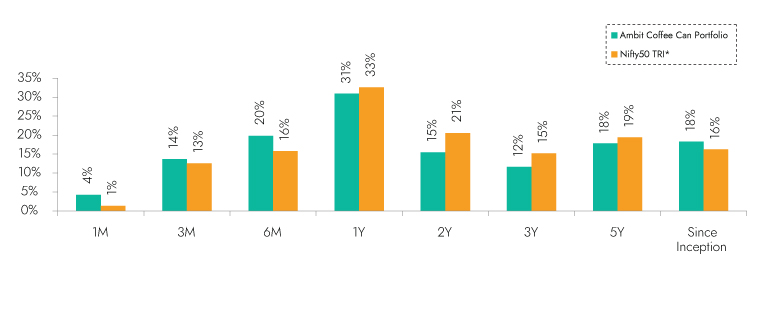
Ambit Coffee Can Portfolio inception date is Mar 06, 2017;
**1M Return: 1st - 31st Aug'24; 3M Return: 1st Jun'24 – 31st Aug'24; 6M Return: 1st Mar'24 – 31st Aug'24; 1Y Return: 1st Sep'23 – 31st Aug'24.*Nifty 50 TRI is the selected benchmark for the Ambit Coffee Can Portfolio. The same is reported to SEBI. In addition to the same, we have included MSCI India for information purposes only. The same should not be relied upon for performance benchmarking in any manner.
Exhibit 43: Ambit’s Coffee Can Portfolio calendar year performance
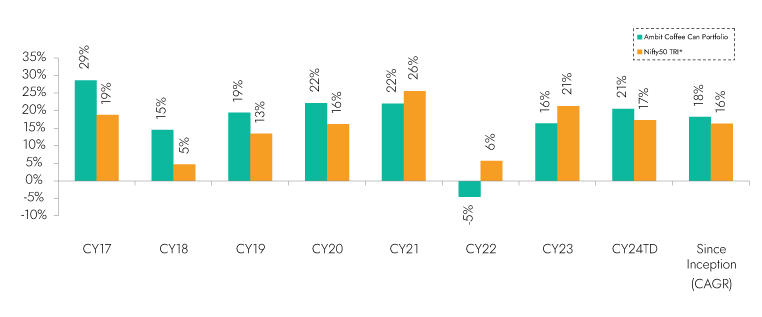
Ambit Coffee Can Portfolio inception date is Mar 06, 2017; *Nifty 50 TRI is the selected benchmark for the Ambit Coffee Can Portfolio. The same is reported to SEBI.
Ambit Good & Clean Midcap Portfolio
Ambit's Good & Clean strategy provides long-only equity exposure to Indian businesses that have an impeccable track record of clean accounting, good governance, and efficient capital allocation. Ambit’s proprietary ‘forensic accounting’ framework helps weed out firms with poor quality accounts, while our proprietary ‘greatness’ framework helps identify efficient capital allocators with a holistic approach for consistent growth. Our focus has been to deliver superior risk-adjusted returns with as much focus on lower portfolio drawdown as on return generation. Some salient features of the Good & Clean strategy are as follows:
- Process-oriented approach to investing: Typically starting at the largest 500 Indian companies, Ambit's proprietary frameworks for assessing accounting quality and efficacy of capital allocation help narrow down the investible universe to a much smaller subset. This shorter universe is then evaluated on bottom-up fundamentals to create a concentrated portfolio of no more than 20 companies at any time.
- Long-term horizon and low churn: Our holding horizons for investee companies are 3-5 years and even longer with annual churn not exceeding 15-20% in a year. The long-term orientation essentially means investing in companies that have the potential to sustainably compound earnings, with these compounding earnings acting as the primary driver of investment returns over long periods.
- Low drawdowns: The focus on clean accounting and governance, prudent capital allocation, and structural earnings compounding allow participation in long-term return generation while also ensuring low drawdowns in periods of equity market declines.
Exhibit 44: Ambit’s Good & Clean Midcap Portfolio point-to-point performance
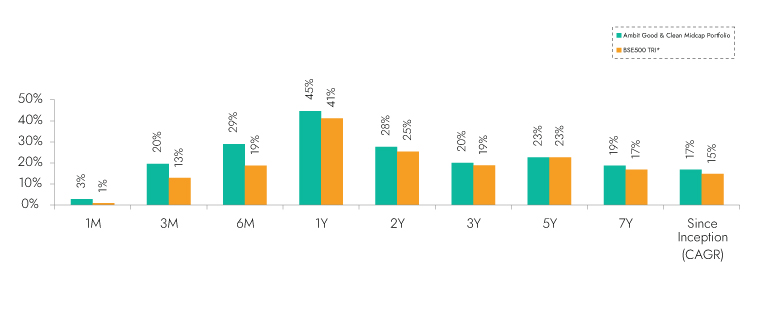
**1M Return: 1st - 31st Aug'24; 3M Return: 1st Jun'24 – 31st Aug'24; 6M Return: 1st Mar'24 – 31st Aug'24; 1Y Return: 1st Sep'23 – 31st Aug'24. *BSE 500 50 TRI is the selected benchmark for the Ambit Good & Clean Mid cap. The same is reported to SEBI. In addition to the same, we have included MSCI Midcap for information purposes only. The same should not be relied upon for performance benchmarking in any manner.
Exhibit 45: Ambit’s Good & Clean Midcap Portfolio calendar year performance
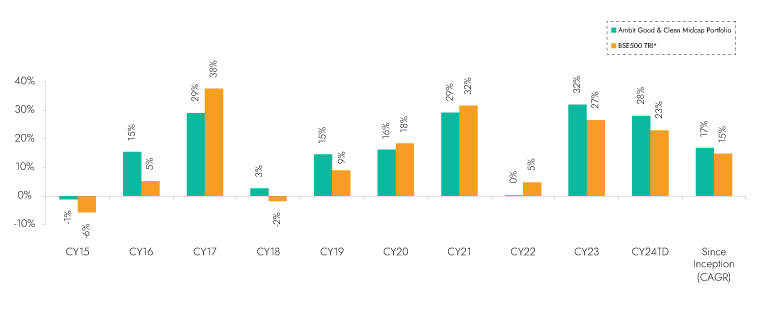
Ambit Good & Clean Mid cap Portfolio inception date is Mar 12, 2015; *BSE 500 50 TRI is the selected benchmark for the Ambit Good & Clean Mid cap. The same is reported to SEBI.
Ambit Emerging Giants Small Cap Portfolio
Small caps with secular growth, superior return ratios and no leverage are the essence of Ambit's Emerging Giants portfolio. The portfolio aims to invest in small-cap companies with market-dominating franchises and a track record of clean accounting, governance and capital allocation. The fund typically invests in companies with market caps less than INR 4,000 cr. These companies have excellent financial track records, superior underlying fundamentals (high RoCE, low debt), and the ability to deliver healthy earnings growth over long periods of time. However, given their smaller sizes, these companies are not well discovered, owing to lower institutional holdings and lower analyst coverage. Rigorous framework-based screening coupled with extensive bottom-up due diligence led us to a concentrated portfolio of 15-16 emerging giants.
Exhibit 46: Ambit Emerging Giants Portfolio point-to-point performance
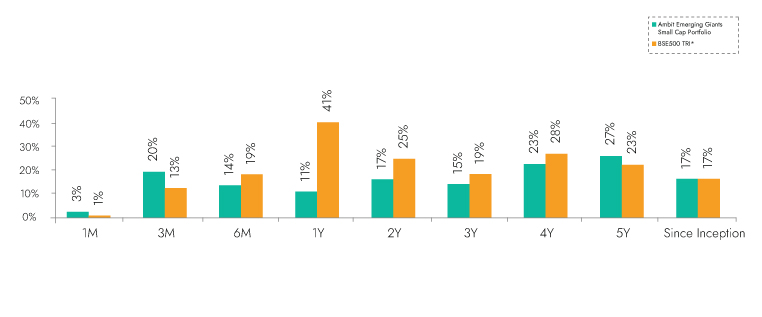
**1M Return: 1st - 31st Aug'24; 3M Return: 1st Jun'24 – 31st Aug'24; 6M Return: 1st Mar'24 – 31st Aug'24; 1Y Return: 1st Sep'23 – 31st Aug'24. *BSE 500 TRI is the selected benchmark for the Ambit Emerging Giants Small cap. The same is reported to SEBI. In addition to the same, we have included MSCI Smallcap for information purposes only. The same should not be relied upon for performance benchmarking in any manner.
Exhibit 47: Ambit Emerging Giants Portfolio calendar year performance
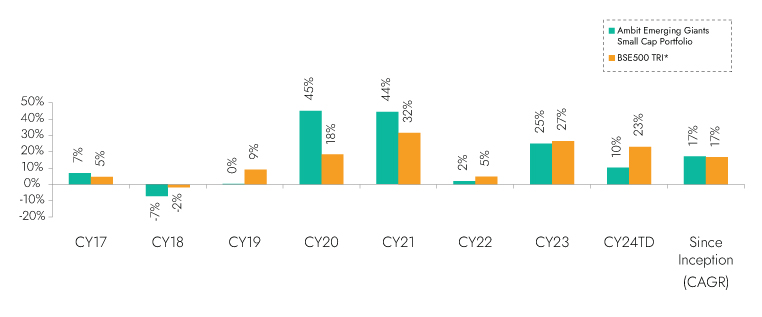
Ambit Emerging Giants Small cap Portfolio inception date is Dec 1, 2017; *BSE 500 TRI is the selected benchmark for the Ambit Emerging Giants Small cap. The same is reported to SEBI.
Ambit TenX Portfolio
Ambit TenX Portfolio allows investors to participate in the India growth story as the Indian GDP heads towards a US $10 tn mark over the next 12-15 years. Medium and smaller corporates are expected to be the key beneficiaries of this growth. The portfolio intends to capitalize on this opportunity by identifying and investing in primarily mid & small cap companies that can grow their earnings 10x over the same period implying 18-21% CAGR.
Key features of this portfolio would be as follows:
- Longer-term approach with a concentrated portfolio: Ideal investment duration of more than five years with 15-20 stocks.
- Key driving factors: Low penetration, strong leadership and light balance sheet
- Forward-looking approach: Relying less on historical performance and more on future potential while not deviating away from the Good & Clean philosophy.
- No Key-man risk: Process is the Fund Manager
Exhibit 48: Ambit TenX Portfolio point-to-point performance
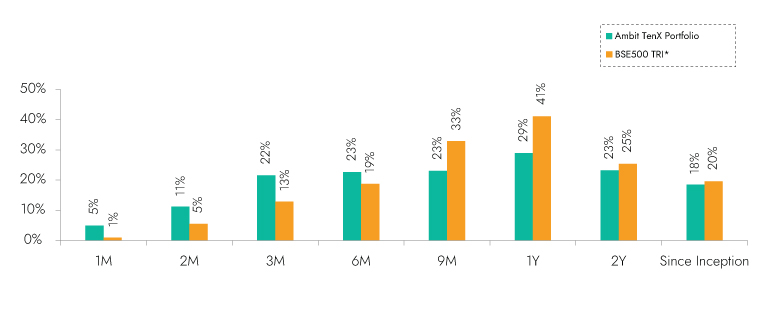
**1M Return: 1st - 31st Aug'24; 3M Return: 1st Jun'24 – 31st Aug'24; 6M Return: 1st Mar'24 – 31st Aug'24; 1Y Return: 1st Sep'23 – 31st Aug'24. *BSE 500 TRI is the selected benchmark for the Ambit TenX Portfolio. The same is reported to SEBI. In addition to the same, we have included MSCI Midcap for information purposes only. The same should not be relied upon for performance benchmarking in any manner.
Exhibit 49: Ambit TenX Portfolio calendar year performance
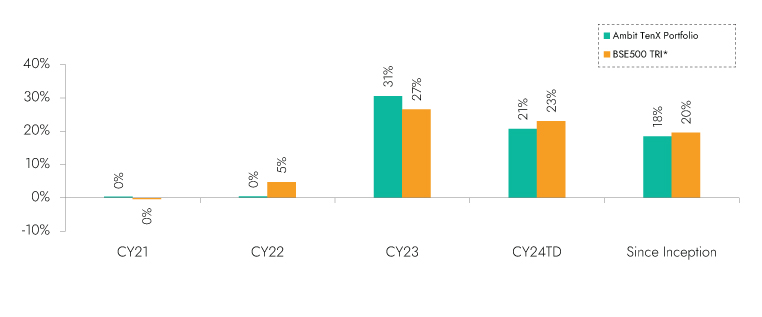
Ambit TenX Portfolio inception date is Dec 13, 2021; *BSE 500 TRI is the selected benchmark for the Ambit TenX Portfolio. The same is reported to SEBI.