.png)
Given the Government’s thrust to boost manufacturing in India over the next decade through measures like announcement of PLIs (Production Linked Incentives), introduction of BIS across several sectors like footwear, LED lighting, switchgears, etc, we believe several sub-sectors within manufacturing are well poised to experience a disproportionately higher growth relative to the last decade.
India at the cusp of a manufacturing boom!
India lags its emerging market peers significantly in manufacturing; empirical evidence shows that manufacturing is a big driver of sustained GDP growth.
If we go back in time and see the periods of high GDP growth across our south-east Asian peers (China, Thailand, Indonesia and Vietnam), we observe that manufacturing as a segment has been one of the biggest drivers among major segments of the economy. China, during its high growth phase (1990 to 2005) witnessed it’s GDP growth at 9.8% CAGR and also experienced share of manufacturing increase from 9.1% in 1990 to 32% in 2005; Indonesia, during its high growth phase (1983 to 1996) witnessed its GDP growth at 6.3% CAGR and also experienced share of manufacturing increase from 13.4% in 1983 to 24.1% in 1996; Vietnam, during its high growth phase (2010 to 2022) witnessed its GDP growth at 6.1% CAGR and also experienced share of manufacturing increase from 19.2% in 2010 to 25.8% in 2022. If India has to see a sustained period of high growth then the contribution from manufacturing is vital which has remained range bound between 13-17%.
Exhibit 1: South East Asian countries during their high growth phases saw significant contribution from manufacturing
1730811651245.jpg)
Source: UBS Research, HDFC MF Report, Ambit Asset Management
India, on the other hand has significantly lagged it’s South East Asian peers on both GDP and manufacturing growth; India’s GDP growth during long periods of time has been <6%. Key reason for this has been the higher dependence on agriculture (growing at muted CAGR of 2.8% over 10 year block periods - see below) alongside lower contribution from manufacturing (growing at sub-optimal pace of 5.9% CAGR over 10 year block periods relative to South East Asian peers during their peak GDP growth phases). Total credit to private non-financial sector (mainly includes manufacturing) as % of GDP at 56% is far lower than 143%, 90% and 86% in China, Malaysia and Thailand respectively.
Exhibit 2: India needs to significantly step up its manufacturing contribution to GDP
1730811666331.jpg)
Source: Macrotrends, Ambit Asset Management
Whilst the contribution from manufacturing has remained range bound at 13%-17%, we would need a sustained period of high growth in our manufacturing activities to contribute and accelerate the overall GDP growth.
Exhibit 3: India’s GDP growth during long periods of time has been at <6% given lower growth in agriculture and low to modest growth in manufacturing and services sector
1730811683804.jpg)
Source: MoSPI, Ambit Capital Research, Ambit Asset Management
Agriculture is unlikely to aid growth over the next decade given India’s marginalized farming which does not support mechanization; share of marginal farming increased from 51% in 1970-71 to 69% in 2015-16. IT industry is also likely to face some headwinds led by rising share of global capability centers (GCC) in India. It’s important for India’s tech industry to diversify their capabilities from just offshore staff augmentation models to building capabilities in managed services led delivery models like consulting, technology and system integration. Engineering research and development services (ER&D) services (relatively small industry) is also emerging as a growth enabler for IT companies; leading global ER&D spenders have maintained their GCCs for over a decade, and yet, companies like LTTS and Tata Technologies, as well as entities in the digital engineering domain such as Hitachi GlobalLogic and Persistent Systems, have registered remarkable growth.
Exhibit 4: India lags significantly behind its perrs on total credit to the private non- financial sector, as % of GDP (Mar-24)
1730811699052.jpg)
Source: MoSPI, Ambit Capital Research, Ambit Asset Management
Agriculture is unlikely to aid growth over the next decade given India’s marginalized farming which does not support mechanization; share of marginal farming increased from 51% in 1970-71 to 69% in 2015-16. IT industry is also likely to face some headwinds led by rising share of global capability centers (GCC) in India. It’s important for India’s tech industry to diversify their capabilities from just offshore staff augmentation models to building capabilities in managed services led delivery models like consulting, technology and system integration. Engineering research anddevelopment services (ER&D) services (relatively small industry) is a classical case study. It emerged as a growth enabler for IT companies; leading global ER&D spenders having despite maintained their GCCs for over a decade; companies like LTTS and Tata Technologies, as well as entities in the digital engineering domain such as Hitachi GlobalLogic and Persistent Systems, have registered remarkable growth.
Agriculture is unlikely to drive gorwth over the next decades given India's marginalsied farming structure which does not support mechanisation
Exhibit 5: 2015 - 2016
1730811762033.jpg)
Exhibit 5A: 1970-1971
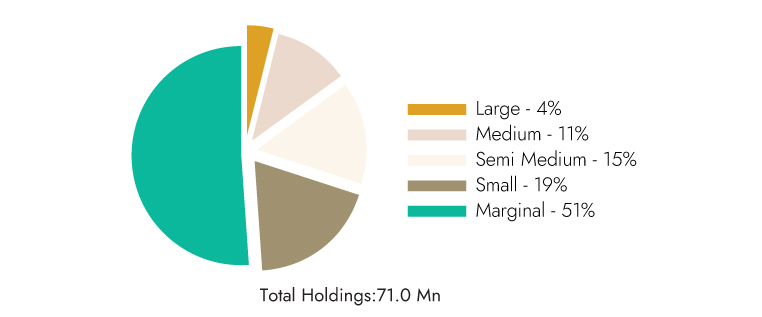
Source: Ambit Asset Management
…and in traditional IT services there is a looming risk of AI and GCC
Exhibit 6: No. of GCCS yr 2023-2029E
1730811820173.jpg)
Exhibit 6A: GCCS headcount (Mn)
1730811857531.jpg)
Exhibit 6B: GCC anual expenditure ($Bn)
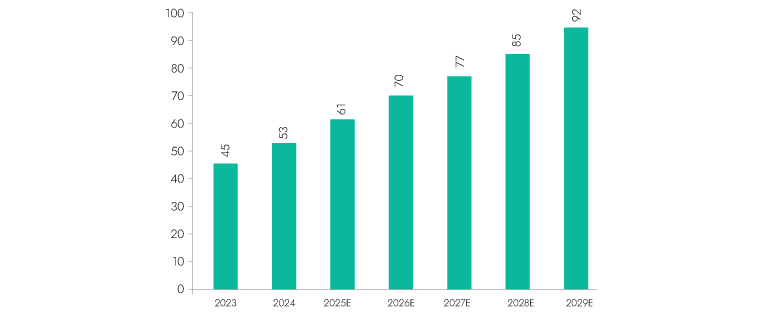
Source: Ambit Asset Management
Contrarily, developed economies have significant GDP growth contribution from services led by high per capita income.
In contrast to emerging economies, developed economies have very different drivers of economic growth. If we look at countries like US and UK, we note that drivers of GDP growth is services which in turn is a function of their ability to spend more given their high per capita income. These services industries include healthcare, education, banking, insurance, IT etc. For India to dream of services sustainably driving GDP growth, the per capita income has to see a significant jump; India’s per capita income at $2,411 in 2022 is far inferior to that of US and UK’s $76,330 and $46,125, respectively.
Developed countries like US/UK have higher share of services in its GDP growth
Exhibit 7: US & UK- Share of services as a % of GDP
1730811879501.jpg)
Source: Macrotrends, Ambit Asset Management
...led by high per capita income in developed countries
Exhibit 8: GDP per capita (US$)
1730811889054.jpg)
Source: Macrotrends, Ambit Asset Management
Can India significantly increase the share of manufacturing in its GDP?
China during 1990-2005 phase came out with a host of enablers to drive its manufacturing growth. Few of the enablers of this growth have been:
- Trade and investment reforms which led to surge in FDI: China capitalized on investments from non-resident Chinese in Hong Kong and Taiwan contributing to early industrial growth in the coastal provinces. Cumulative FDI from Hong Kong alone made up about 55% of China's total FDI by 2000.
- SEZ laws which allowed China to be an outsourced manufacturing partner of the globe: The establishment of SEZs was a critical factor; between 1979 and 1983, China set up four SEZs in Guangdong and Fujian provinces, which attracted significant FDI. By 1995, there were 224 SEZs across China, contributing to its rapid industrialization; in 2005, ~60% of China’s exports were linked to FDI-related activities, showing the pivotal role of foreign investment in boosting the manufacturing sector. These SEZs were given special tax treatment, less regulation, and preferential access to capital. These zones accounted for ~89% of China’s total exports by 1985 and 93% by 2005.
- Aggressive infrastructure development: China invested heavily in infrastructure development including roads, railways, and power generation, which supported its industrial base. Road length grew from 2,50,700 kms in 2000 to 19,30,500 kms in 2005; railway network expanded from 53,300 kms in 1990 to 66,200 kms in 2010 and electricity generation capacity expanded by 400% between 1990 to 2003.
- Using currency policy as export subsidy: China maintained an undervalued currency pegged to the dollar at 8.28 yuan/USD from 1994 to 2005, making its exports cheaper and more competitive. This exchange rate policy was considered an indirect export subsidy, which supported higher export growth.
- Designing market friendly labour laws: Labor reforms included introducing temporary contracts and allowing hiring and firing flexibility, which increased labour productivity, over 1985 to 1995, the share of contract workers rose from 4% to 39% of total employment.
Exports as % of GDP significantly surged in China from 12.5% in 1990 to 33.8% in 2005
Exhibit 9: China: Export of good and servcies as a % of GDP
1730811901940.jpg)
Source: Macrotrends, Ambit Asset Management
FDI inflows in China significantly surged from 0.9% in 1990 to 4.6% in 2005
Exhibit 10: China: FDI omflows as a % of GDP
1730811922132.jpg)
Source: Macrotrends, Ambit Asset Management
India too is now replicating the Chinese template by creating several enablers to boost its "Make in India" initiative. Recently the Government published a report summarizing the 10 years of make in India. The key highlights of the report are as below:
Launched on September 25, 2014, by Prime Minister Narendra Modi, the "Make in India" initiative is completing 10 years as a pivotal step in India's nation-building efforts. The report talks about 9 enablers for the success of make in India campaign; few of them are summarized below
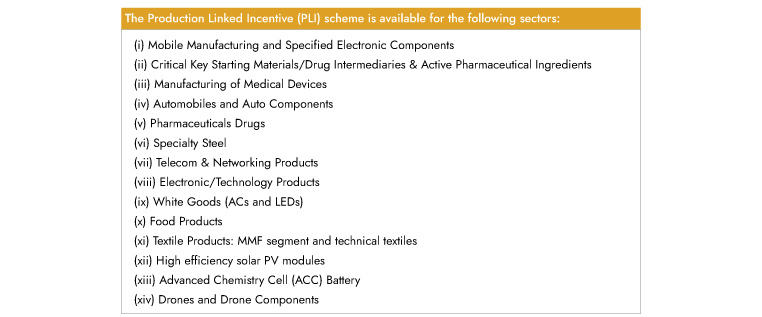
- PLIs: This scheme was introduced to enhance India’s manufacturing capabilities and boost exports. With an outlay of INR 1.97 lakh crore (>US$26 billion), the schemes cover 14 key sectors aimed at fostering investment in cutting-edge technology and promoting global competitiveness. As of 30th July, 2024, 755 applications have got approved across these sectors, leading to an investment realization of INR 1.23 lakh crore by March 2024. This investment has generated employment for approximately 8 lakh individuals, marking a significant stride towards achieving the objectives of the PLI scheme.
Table: List the 14 sectors that are beneficiaries of the PLI scheme
- Semi-conductor ecosystem development: In 2021, the union cabinet approved the semi-conductor India program with an outlay of INR760bn (>$$9bn). India has crafted policies that support several segments of the semiconductor ecosystem, extending beyond just fabrication plants (fabs) to include packaging, display technologies, outsourced semiconductor assembly and testing (OSAT), sensors, and more. The first major project with Micron was sanctioned for nearly INR220bn (~$3bn) and Tata's joint venture with Taiwan’s Powerchip in Dholera also is a promising development.
- Start-up India: Start-up India Initiative has rolled out several programs aimed at supporting entrepreneurs. As of September 25, 2024, India has the third-largest start-up ecosystem in the world, with 148,931 DPIIT Recognized Start-ups, which have created over 15.5 lakh direct jobs.
- Ease of doing business: India has made significant progress in improving its business environment, climbing from 142nd in 2014 to 63rd in the World Bank’s Doing Business Report (DBR) 2020, published in October 2019 before its discontinuation. This 79-rank jump over five years reflects the government’s sustained efforts to simplify regulations, reduce bureaucratic hurdles, and create a more business-friendly environment, significantly boosting investor confidence and supporting the objectives of the "Make in India" initiative.
Manufacturing has been key driver for India’s fastest growing states on GDP
We analyzed the aggregates of the top six Indian states (collectively account for >50% of India’s GDP) by GDP contribution & growth over the FY2012 to 2022 period (data not available post 2022). We note that the biggest driver for their GDP growth has been manufacturing which achieved a CAGR of 6.7% during this period followed by services and other industrials growing at a CAGR of 6.2% & 4.7% respectively. This further reinforces our belief that for India to sustainably grow its GDP and become a $10 trillion economy by FY2032, the appropriate template is to invest in manufacturing.
India’s top six states by GDP contribution have grown on the back of strong growth in manufacturing
Exhibit 11: GDP and manufacturing sector growth
1730811934165.jpg)
Source: Macrotrends, Ambit Asset Management
* GSDP - Gross State Domestic Products
….resulting in share of manufacturing on an aggregate for these states rising to 19.5% of their GDP in FY2022 from 18% in FY2012
Exhibit 12:Share of various sectors
1730812580526.jpg)
Source: Macrotrends, Ambit Asset Management
Conclusion:
As India stands on the verge of a manufacturing renaissance, several pockets of manufacturing are likely to emerge as disproportionate beneficiaries like capital goods, infrastructure, consumer durables and specialty chemicals.
Our strategy is aligned to capitalize on this booming landscape, and we’ve structured our portfolio to capture growth across key sectors set to thrive in this environment. Our sector weights are tilted more towards industrials, capital goods, and building materials, as these sectors will be the core beneficiaries of increased production and infrastructure investments.
Additionally, our exposure to banking and financials positions us to benefit from the increased credit demand that will follow large-scale manufacturing investments. This overweight compared to benchmark standards allows us to stay ahead of market trends and positions us for long-term gains.
Our portfolio further diversifies into pharmaceuticals and specialty chemicals, sectors that will benefit as India strengthens its footprint in global supply chains for essential goods and materials. With robust allocations across high-growth industries, our portfolio is positioned to capture the economic momentum building across India’s evolving manufacturing landscape.
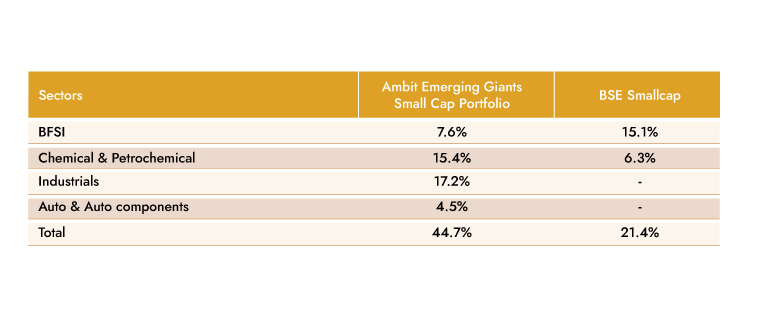
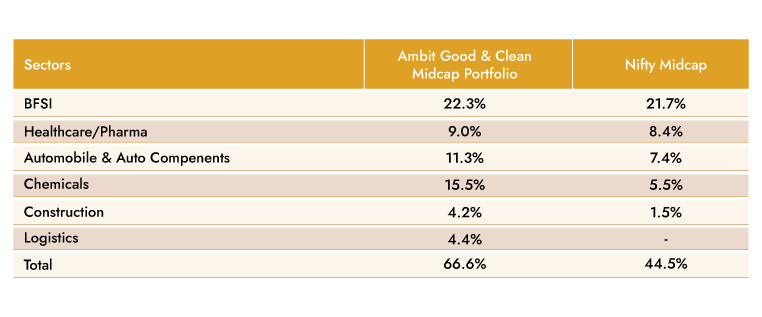
Our portfolio weights:
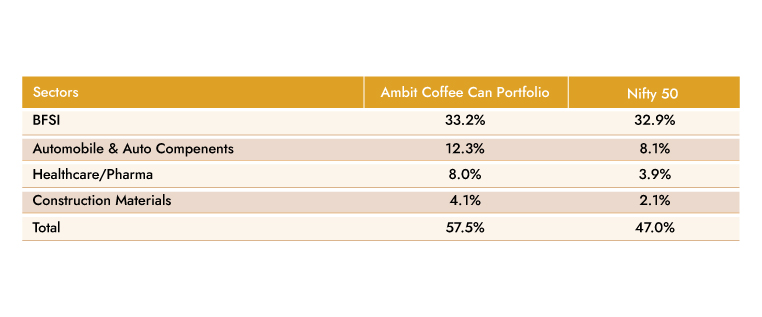
AMBIT COFFEE CAN PORTFOLIO
At Coffee Can Portfolio, we do not attempt to time commodity/investment cycles or political outcomes and prefer resilient franchises in the retail and consumption-oriented sectors. The Coffee Can philosophy has an unwavering commitment to companies that have consistently sustained their competitive advantages in core businesses despite being faced with disruptions at regular intervals. As the industry evolves or is faced with disruptions, these competitive advantages enable such companies to grow their market shares and deliver long-term earnings growth.
Exhibit 13: Ambit’s Coffee Can Portfolio point-to-point performance
1730812625677.jpg)
Source: Ambit Coffee Can Portfolio inception date is Mar 06, 2017;**1M Return: 1st - 31st Oct'24; 3M Return: 1st Aug'24 – 31st Oct'24; 6M Return: 1st May'24 – 31st Oct'24; 1Y Return: 1st Nov'23 – 31st Oct'24 *Nifty 50 TRI is the selected benchmark for the Ambit Coffee Can Portfolio. The same is reported to SEBI.
Exhibit 14: Ambit’s Coffee Can Portfolio calendar year performance
1730812635900.jpg)
Ambit Coffee Can Portfolio inception date is Mar 06, 2017; *Nifty 50 TRI is the selected benchmark for the Ambit Coffee Can Portfolio. The same is reported to SEBI.
Ambit Good & Clean Midcap Portfolio
Ambit's Good & Clean strategy provides long-only equity exposure to Indian businesses that have an impeccable track record of clean accounting, good governance, and efficient capital allocation. Ambit’s proprietary ‘forensic accounting’ framework helps weed out firms with poor quality accounts, while our proprietary ‘greatness’ framework helps identify efficient capital allocators with a holistic approach for consistent growth. Our focus has been to deliver superior risk-adjusted returns with as much focus on lower portfolio drawdown as on return generation. Some salient features of the Good & Clean strategy are as follows:
- Process-oriented approach to investing: Typically starting at the largest 500 Indian companies, Ambit's proprietary frameworks for assessing accounting quality and efficacy of capital allocation help narrow down the investible universe to a much smaller subset. This shorter universe is then evaluated on bottom-up fundamentals to create a concentrated portfolio of no more than 20 companies at any time.
- Long-term horizon and low churn: Our holding horizons for investee companies are 3-5 years and even longer with annual churn not exceeding 15-20% in a year. The long-term orientation essentially means investing in companies that have the potential to sustainably compound earnings, with these compounding earnings acting as the primary driver of investment returns over long periods.
- Low drawdowns: The focus on clean accounting and governance, prudent capital allocation, and structural earnings compounding allow participation in long-term return generation while also ensuring low drawdowns in periods of equity market declines.
Exhibit 15: Ambit’s Good & Clean Midcap Portfolio point-to-point performance
1730812648566.jpg)
Source:**1M Return: 1st - 31st Oct'24; 3M Return: 1st Aug'24 – 31st Oct'24; 6M Return: 1st May'24 – 31st Oct'24; 1Y Return: 1st Nov'23 – 31st Oct'24
*BSE 500 TRI is the selected benchmark for the Ambit Good & Clean Mid cap. The same is reported to SEBI.
Exhibit 16: Ambit’s Good & Clean Midcap Portfolio calendar year performance
1730812657226.jpg)
Ambit Good & Clean Mid cap Portfolio inception date is Mar 12, 2015; *BSE 500 50 TRI is the selected benchmark for the Ambit Good & Clean Mid cap. The same is reported to SEBI.
Ambit Emerging Giants Small Cap Portfolio
Small caps with secular growth, superior return ratios and no leverage are the essence of Ambit's Emerging Giants portfolio. The portfolio aims to invest in small-cap companies with market-dominating franchises and a track record of clean accounting, governance and capital allocation. The fund typically invests in companies with market caps less than INR 4,000 cr. These companies have excellent financial track records, superior underlying fundamentals (high RoCE, low debt), and the ability to deliver healthy earnings growth over long periods of time. However, given their smaller sizes, these companies are not well discovered, owing to lower institutional holdings and lower analyst coverage. Rigorous framework-based screening coupled with extensive bottom-up due diligence led us to a concentrated portfolio of 15-16 emerging giants.
Exhibit 17: Ambit Emerging Giants Portfolio point-to-point performance
1730812666581.jpg)
Source: **1M Return: 1st - 31st Oct'24; 3M Return: 1st Aug'24 – 31st Oct'24; 6M Return: 1st May'24 – 31st Oct'24; 1Y Return: 1st Nov'23 – 31st Oct'24
*BSE 500 TRI is the selected benchmark for the Ambit Emerging Giants Small cap. The same is reported to SEBI.
Exhibit 18: Ambit Emerging Giants Portfolio calendar year performance
1730812677161.jpg)
Ambit Emerging Giants Small cap Portfolio inception date is Dec 1, 2017; *BSE 500 TRI is the selected benchmark for the Ambit Emerging Giants Small cap. The same is reported to SEBI.
Ambit TenX Portfolio
Ambit TenX Portfolio allows investors to participate in the India growth story as the Indian GDP heads towards a US $10 tn mark over the next 12-15 years. Medium and smaller corporates are expected to be the key beneficiaries of this growth. The portfolio intends to capitalize on this opportunity by identifying and investing in primarily mid & small cap companies that can grow their earnings 10x over the same period implying 18-21% CAGR.
Key features of this portfolio would be as follows:
- Longer-term approach with a concentrated portfolio: Ideal investment duration of more than five years with 15-20 stocks.
- Key driving factors: Low penetration, strong leadership and light balance sheet
- Forward-looking approach: Relying less on historical performance and more on future potential while not deviating away from the Good & Clean philosophy.
- No Key-man risk: Process is the Fund Manager
Exhibit 19: Ambit TenX Portfolio point-to-point performance
1730812685108.jpg)
Source: **1M Return: 1st - 31st Oct'24; 3M Return: 1st Aug'24 – 31st Oct'24; 6M Return: 1st May'24 – 31st Oct'24; 1Y Return: 1st Nov'23 – 31st Oct'24
*BSE 500 TRI is the selected benchmark for the Ambit TenX Portfolio. The same is reported to SEBI.
Exhibit 20: Ambit TenX Portfolio calendar year performance
1730812694576.jpg)
Ambit TenX Portfolio inception date is Dec 13, 2021; *BSE 500 TRI is the selected benchmark for the Ambit TenX Portfolio. The same is reported to SEBI.