.png)
We believe this trend reversal is now playing out in earnest and set to accelerate. This should benefit Ambit Asset Management’s distinctive bottom-up investment style which is marked by focus on pricing power plays, low beta, capital protection, commitment to quality and concentrated portfolios. In this newsletter, we discuss the following: 1) why ‘Zomato’, one of our core holding is a rare pricing power play, 2) how portfolios based on pricing power stocks outperform globally and 3) reversal of post covid style divergence of (FY21-1H25).
- ‘Zomato’ a rare pricing power play In the words of Warren Buffett, “The single most important decision in evaluating a business is pricing power. If you have got the power to raise pricing without losing business to a competitor, you have got a very good business.” Enduring competitive advantage comes from sustaining higher relative prices or lower relative costs, or both, than your rivals in an industry. Pricing power companies tend to be less glamorous and newsworthy (exceptions when at early life cycle), but instead are quiet and stable quality “compounders”. Hence, the focus of ACCP is to identify companies with increasing pricing power, which are driving the widest wedge between customer’s willingness to pay (WTP) and supplier’s willingness to supply (WTS). Most companies have either a 1) DifferentiationAdvantage (Price) or a 2) Cost Advantage (Cost). It is rare to find a company which enjoys distinct advantage across both end of value stick, like Zomato.
Exhibit 1: Zomato enjoys distinct advantages across both end of value chain
1733463325061.jpg)
Source: Ambit Asset Management
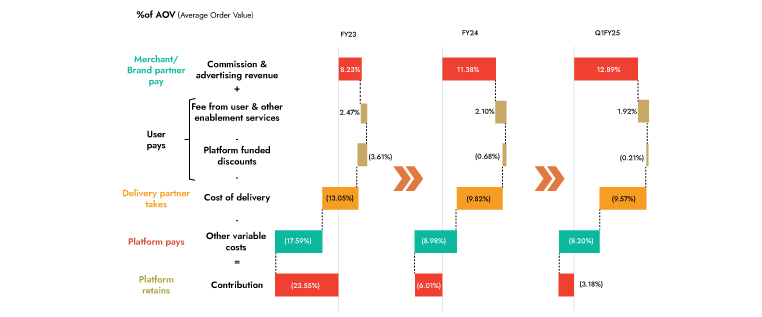
Zomato’s advantage is clearly more valid for the food delivery business. In the quick commerce vertical (accounting for >56% of company value), even though Zomato has leadership advantage, it is still early days and competitive intensity is increasingly sharply. Nonetheless, even though, competition is increasing sharply in quick commerce, Zomato has some unique advantages compared to all its key competitors. A glance at the unit economics and market share of Zomato vs its nearest competitor Swiggy, highlights the relative price and cost advantages. Higher market share and growth is despite, Zomato having lower discounts and no loyalty or co-branded promotion programs.
Exhibit 2: Relative price and cost advantage against its closest competitor
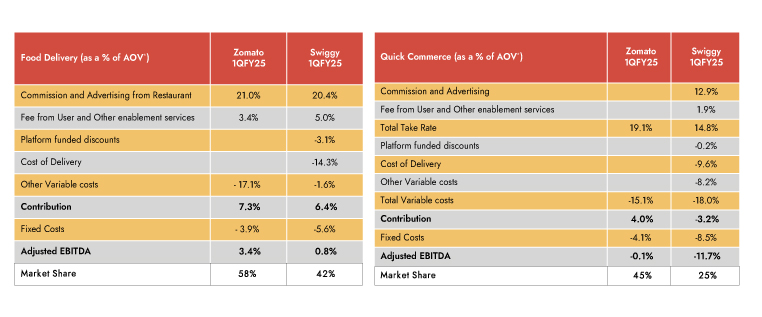
Source: Comapny, Swiggy RHP, Ambit Research; Ambit Asset Management
Exhibit 3: 2QFY25 - Food Vertical – WTP (Willingness to Pay) and Cost Advantage
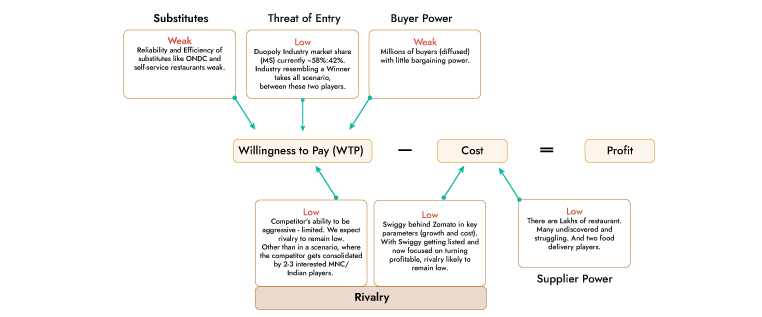
Source: Ambit Asset Management
Exhibit 4: Quick Commerce (QC) - WTP and Cost Advantage
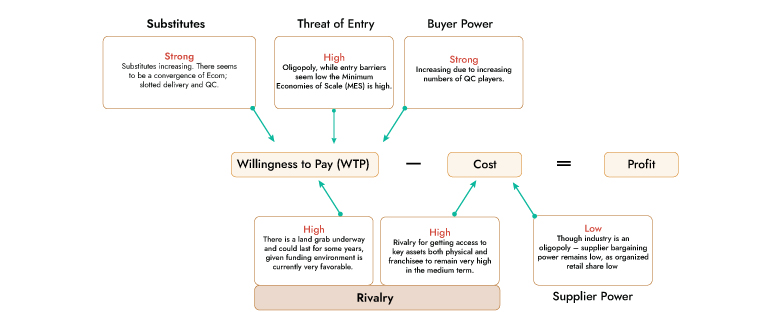
Source: Ambit Asset Management
Exhibit 5: Relative advantage across Food delivery and QC vertical w.r.t to Key Players
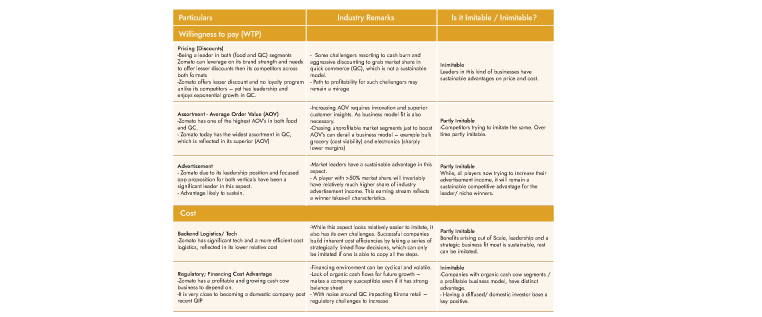
Source: Ambit Asset Management
Comparison with respect to Competitors existing and future
Unlike the food delivery vertical the potential of QC vertical is significantly larger (3-4x). Hence, we expect, the QC vertical to have multiple (3-5) winners. In the last few quarters, there seems to be increasing convergence between QC ($6b market), e-commerce (US55$b market) and slotted delivery (US$2b market) verticals. Hence, while increasing competitive intensity is concerning, when viewed in the context of 1) Increasing addressable market (TAM) for the QC and 2) Room for 3-5 unique winners; increasing competitive intensity seems less concerning. Furthermore, we believe, while this is the top-down industry view, when we look at relative strength of Zomato against its rivals, Zomato seems to have distinct advantages in both verticals.
Relative advantages against competitors existing and emerging in Quick Commerce (QC):
A)Swiggy: Swiggy lags behind Zomato on both growth and cost, across both verticals. Zomato has ~58% market share in food vertical which we expect to increase to >60% in next few years, but more importantly likely to account for >75% of industry profits. In the QC vertical Zomato has significantly higher shareof advertisement income and higher scale, which in a very competitive landscape is a key moat. We expect both Zomato and Swiggy to account for bulk of profits in both verticals in medium term, resembling a winner takes all characteristics, which is visible in many other such similar industries.
B) Zepto: Zepto (~28% market share QC) has been the most aggressive on pricing in recent times. Higher discounting is ‘its key customer acquisition tool’. Zepto has key disadvantage against both Zomato (~46% market share QC and 58% food delivery) and Swiggy (42% market share food delivery and ~26% QC) with respect to customer acquisition cost, synergy, and scale benefits. As per Swiggy RHP, almost ~78% of its Instamart users in FY24, first transacted on its food delivery platform (while ~27% users used more than one offering), we estimate this number to be also >65% for Zomato, which gives both these players key advantage w.r.t to customer acquisition cost. We reckon Zepto, has ~3-7% structural price/cost disadvantage versus Swiggy/ Zomato. This relative price/ cost differential will be difficult to reverse.
Exhibit 6: Contribution margin breakdown for QC
Source: Swiggy RHP, Ambit Asset Management
C) Dmart Ready and bbnow: Dmart Ready as per the management will remain in the large basket slotted delivery segment and not try and compete in the convenience QC industry vertical. Bbnow (three formats- bigbasket, bbnow and neuflash) on the other hand as per media news desires to compete in the convenience vertical and bring down its slotted delivery time sharply. Our view is that monthly bulk purchase is not a viable vertical for QC, given the cost and operational dynamics.
D) Amazon, Walmart and Jiomart: Both Amazon and Walmart are venturing into the quick delivery vertical as their e-com business model is getting disrupted. Increasingly more low value items and urgent use items, which were hitherto a domain of E-commerce is migrating to QC. Initially, the view was that only ~20-25% of the e-com categories were vulnerable to QC, while the rest (beauty, apparel fashion and heavy electronics) seemed less prone to disruption. Nonetheless, this can evolve very fast. In that respect, E-commerce companies venture into QC seems more of a survival move. Already the existing businesses of both E-com players are in losses, with this foray and multiple business model losses are likely to increase further. We also feel,
they are more susceptible to regulatory risks as both entities remain foreign owned companies (retail rules differ for foreign and domestic players). Most QC companies are making concerted attempts to change their identity to domestic companies (Zomato closest) to better cope with regulatory challenges. Jiomart is the dark horse here, it has had limited success till now, compared to its ambitions. We believe, most of these players will find M&A a better alternative compared to organic foray into QC at this stage.
2) Portfolios based on pricing power stocks outperform globally
Pricing power companies tend to be less glamorousand newsworthy (exceptions when at early life cycle), but instead are quiet and stable quality “compounders”. As a novel equity factor, pricing power has outperformed the market not just during inflationary episodes, but steadily over the long run
across the globe. Steve Hou in a Bloomberg research paper christened ‘Pricing Power Everywhere’ identified that US public companies with great pricing power, have historically delivered strong and steady equity returns with lower risk and higher returns than the broad equity market benchmark index, over the last 15 years.
Exhibit 7: Extract from Bloomberg research paper ‘Pricing Power Everywhere’ 2007-2023
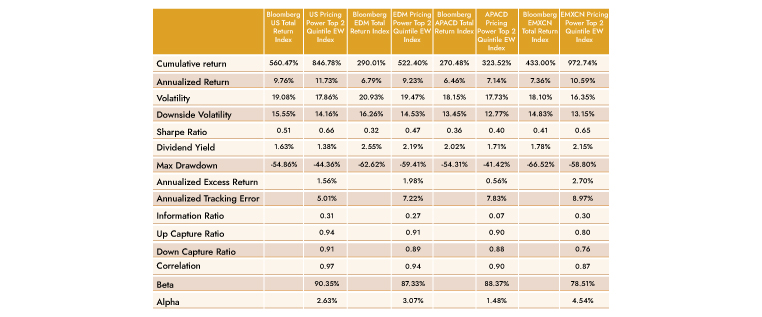
Table 2: Performances of Pricing Power indices across the globe from 2003-06-30 to 2023-10-12. The Pricing Power index in each region selects securities in the top two quintiles with the greatest pricing power after certain liquidity and quality screens, is then equal weighted and rebalanced quarterly. US: Bloomberg US Large and Mid-Cap Index; EDM: Bloomberg Europe Developed Markets Large and Mid-Cap Index; APACD: Bloomberg Asia-Pacific Developed Markets Large and Mid-Cap Index; EMXCN: Bloomberg Emerging Markets ex-China Large and Mid- Cap Index.
Source: Bloomberg, Ambit Asset Management
The research paper further reveals that the outperformance of the pricing power factor extends beyond the US, across various global markets with similar characteristics. If the pricing power factor only performed well in the US from 2007 to 2023, it may have been less persuasive. The study from 2003 to 2023, reveals that the pricing power factor has exhibited similar characteristics across different geographical regions.
Pricing power stocks being expensive
Since pricing power is such a pervasive concept, there are good reasons to expect that it is already “priced in” by the market and therefore does not offer consistent outperformance. However, it turns out companies with strong pricing power, have historically earned consistently strong returns while
simultaneously maintaining a lower risk profile. Moreover, they have demonstrated similar characteristics across different geographical markets lending credence to the long-run reliability of pricing power as an investment factor.
Exhibit 8:Over 15 years BPPUS index has outperformed the UST Index in both up and down years
1733464085922.jpg)
Source: Annual Performances of the Bloomberg Pricing Power Index (BPPUST) versus the Bloomberg US Large and Mid-Cap Index (UST). Source: Bloomberg
Exhibit 9: Reversal of post COVID style anomaly
1733474477794.jpg)
Source: Ambit Asset Management
3) Reversal of style divergence
During the period FY21-1HFY25, market was characterized by high beta, risk-on sentiments, and a retail-led broad-based SMID-driven rally. During such
high beta bull cycles, disciplined long-term investing style and investing principles go out of favour. Short termism and greed prevail. There is a rush to go down the quality curve and take higher risks. This sets the stage for a market shakeout and eventual manifestation of the No.1 risk, which is permanent capital loss. This investor behaviour is what causes investment style cycles. If one were to go into history for similar divergences, the time periods with such divergence would be FY91-94 and FY04-07. Though this rally has been driven in the backdrop of high relative earnings growth for mid and small-caps and improving fundamentals. Nonetheless, majority of the industries/ sub segments, which led this rally over FY21 to 1HFY25 were cyclical, had low return ratios and absence of any history of sustainable wealth creation. We believe, the key catalysts driving this reversal are A)
Bottoming of ‘falling concentration’, B) Earnings growth differential reversing in favour of heavyweights and C) valuations disparity between large cap and SMID widening. Our investment strategy is meticulously crafted to navigate these challenges, aiming to achieve our investment objectives while
steering clear of common behavioural biases and institutional imperatives.
Exhibit 10: Market concentration at all-time low and reversing
Denote CAGR returns during periods for Nifty 50, Midcap 100 and Smallcap 100 (CAGR %)
1733467368522.jpg)
Source: Ambit Asset Management
Exhibit 11A: 2QFY25 Earnings differential expanding between Top 100 market cap and SMID
1733467378217.jpg)
Exhibit 11B: Earnings cut for FY25 have been higher for broader SMID
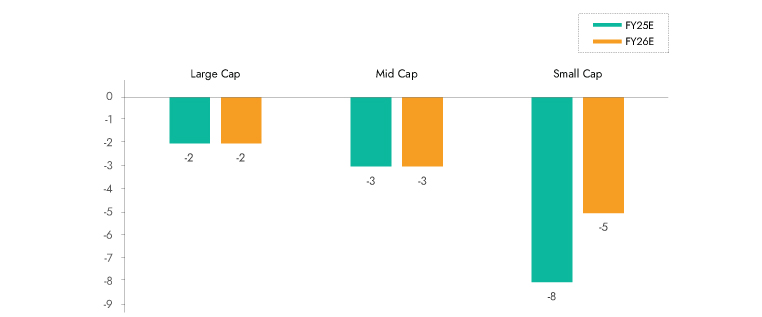
Source: Ambit Research, Ambit Asset Management
Exihibt 12: Ambit portfolios delivered strong earnings growth
1733465564567.jpg)
Source: Kotak Institutional Equitites, Ambit Asset Management
Exhibit 13A: FY25E equity supply Rs 7.5 tn, of which Rs 1.5 tn was secondary sales by domestic promoters
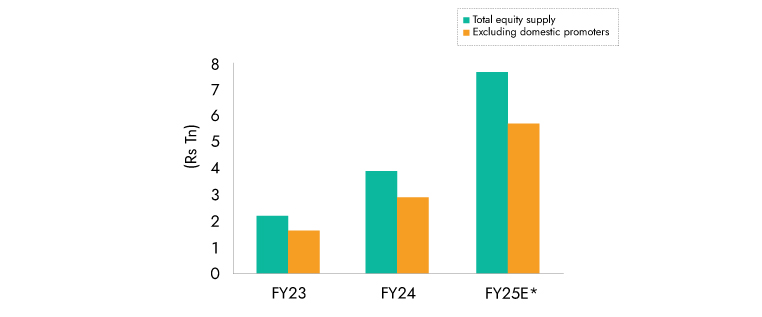
Source: Axis Capital Estimates, Ambit Asset Management
Exhibit 13B : A large part of supply via IPO, QIP, or to foreign promoters/PE(funds exited local market)
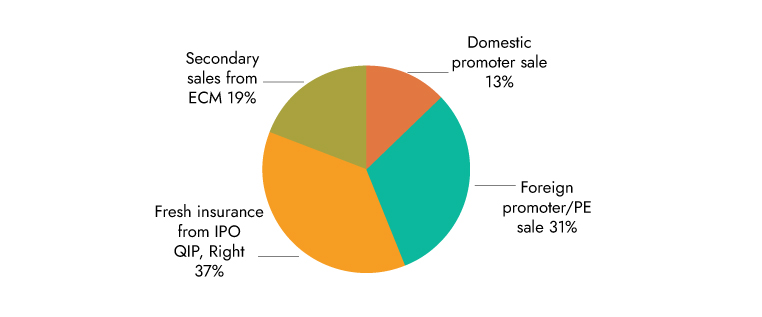
Source: Axis Capital Estimates, Ambit Asset Management
Exhibit 14: Valuations divergence between large and SMID remain near all time high
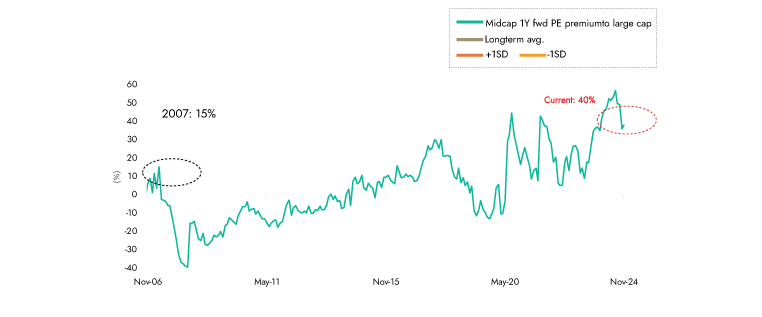
Source: Kotak Institutional Equities, Ambit Asset Management
Conclusion:
In our June’24 and September’24 newsletters, we highlighted how the market sentiment post COVID lows (FY21-1HFY25), was at stark divergence to our investment style and how it has started exhibiting signs of reversal. The key catalysts driving this reversal are 1) Moderating earnings and macro-economic growth outlook, 2) Supply avalanche, 3) Bottoming of ‘falling concentration’, 4) Growth differential reversing in favor of heavyweights and 5) Valuations disparity between large cap and SMID continuing to be wide. This should benefit Ambit Asset Management’s distinctive bottom-up investment style which is marked by focus on pricing power plays, low beta, capital protection, commitment to quality and concentrated portfolios. As a novel equity factor, pricing power has outperformed the market not just during inflationary episodes, but steadily over the long run across the globe. Pricing power companies tend to be less glamorous and newsworthy (exceptions when at early life cycle), instead are quiet and stable quality “compounders”. Hence, the focus of Ambit Asset Management is to identify companies with increasing pricing power, which are driving the widest wedge between customer’s willingness to pay (WTP) and supplier’s willingness to supply (WTS).
AMBIT COFFEE CAN PORTFOLIO
At Coffee Can Portfolio, we do not attempt to time commodity/investment cycles or political outcomes and prefer resilient franchises in the retail and consumption-oriented sectors. The Coffee Can philosophy has an unwavering commitment to companies that have consistently sustained their competitive advantages in core businesses despite being faced with disruptions at regular intervals. As the industry evolves or is faced with disruptions, these competitive advantages enable such companies to grow their market shares and deliver long-term earnings growth.
Exhibit 15: Ambit’s Coffee Can Portfolio point-to-point performance
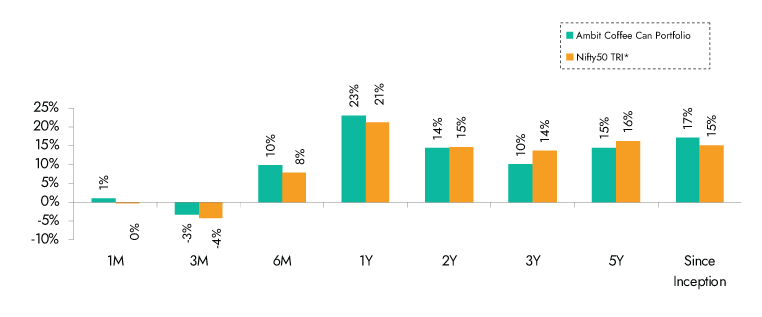
Source: Ambit Coffee Can Portfolio inception date is Mar 06, 2017;**1M Return: 1st - 31st Oct'24; 3M Return: 1st Aug'24 – 31st Oct'24; 6M Return: 1st May'24 – 31st Oct'24; 1Y Return: 1st Nov'23 – 31st Oct'24 *Nifty 50 TRI is the selected benchmark for the Ambit Coffee Can Portfolio. The same is reported to SEBI.
Exhibit 16: Ambit’s Coffee Can Portfolio calendar year performance
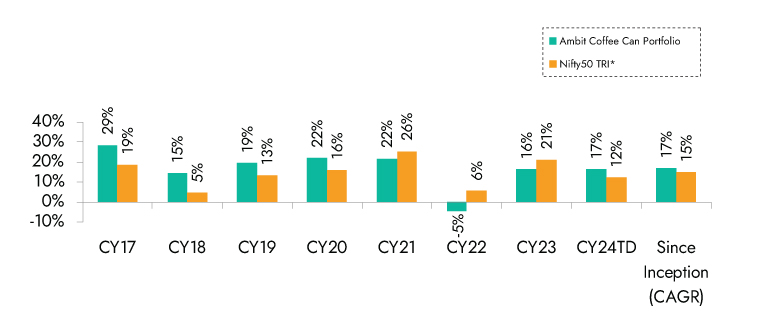
Ambit Coffee Can Portfolio inception date is Mar 06, 2017; *Nifty 50 TRI is the selected benchmark for the Ambit Coffee Can Portfolio. The same is reported to SEBI.
Ambit Good & Clean Midcap Portfolio
Ambit's Good & Clean strategy provides long-only equity exposure to Indian businesses that have an impeccable track record of clean accounting, good governance, and efficient capital allocation. Ambit’s proprietary ‘forensic accounting’ framework helps weed out firms with poor quality accounts, while our proprietary ‘greatness’ framework helps identify efficient capital allocators with a holistic approach for consistent growth. Our focus has been to deliver superior risk-adjusted returns with as much focus on lower portfolio drawdown as on return generation. Some salient features of the Good & Clean strategy are as follows:
- Process-oriented approach to investing: Typically starting at the largest 500 Indian companies, Ambit's proprietary frameworks for assessing accounting quality and efficacy of capital allocation help narrow down the investible universe to a much smaller subset. This shorter universe is then evaluated on bottom-up fundamentals to create a concentrated portfolio of no more than 20 companies at any time.
- Long-term horizon and low churn: Our holding horizons for investee companies are 3-5 years and even longer with annual churn not exceeding 15-20% in a year. The long-term orientation essentially means investing in companies that have the potential to sustainably compound earnings, with these compounding earnings acting as the primary driver of investment returns over long periods.
- Low drawdowns: The focus on clean accounting and governance, prudent capital allocation, and structural earnings compounding allow participation in long-term return generation while also ensuring low drawdowns in periods of equity market declines.
Exhibit 17: Ambit’s Good & Clean Midcap Portfolio point-to-point performance
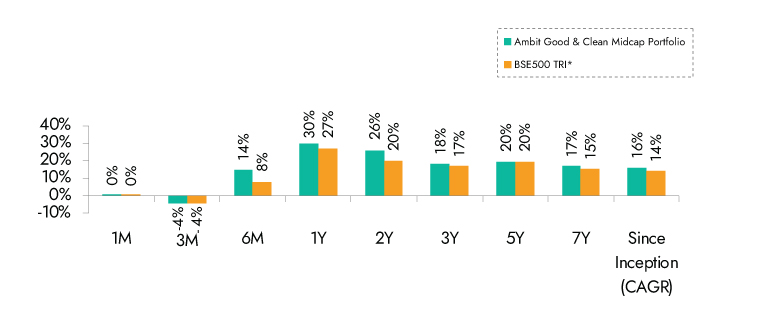
Source: Ambit Good & Clean Mid cap Portfolio inception date is Mar 12, 2015;**1M Return: 1st - 30th Nov'24; 3M Return: 1st Sep'24 – 30th Nov'24; 6M Return: 1st Jun'24 – 30th Nov'24; 1Y Return: 1st Dec'23 – 30th Nov'24 *BSE 500 TRI is the selected benchmark for the Ambit Good & Clean Mid cap. The same is reported to SEBI.
Exhibit 18: Ambit’s Good & Clean Midcap Portfolio calendar year performance
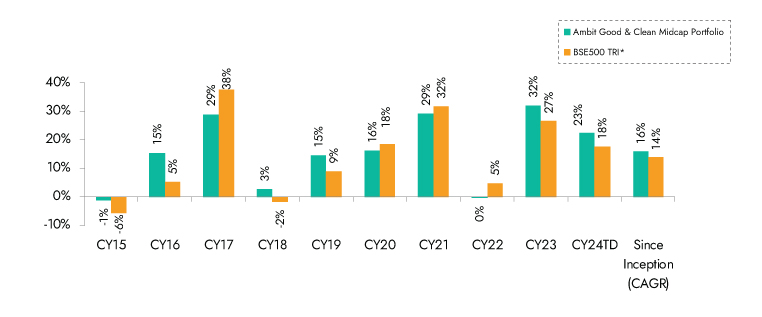
Ambit Good & Clean Mid cap Portfolio inception date is Mar 12, 2015; *BSE 500 50 TRI is the selected benchmark for the Ambit Good & Clean Mid cap. The same is reported to SEBI.
Ambit Emerging Giants Small Cap Portfolio
Small caps with secular growth, superior return ratios and no leverage are the essence of Ambit's Emerging Giants portfolio. The portfolio aims to invest in small-cap companies with market-dominating franchises and a track record of clean accounting, governance and capital allocation. The fund typically invests in companies with market caps less than INR 4,000 cr. These companies have excellent financial track records, superior underlying fundamentals (high RoCE, low debt), and the ability to deliver healthy earnings growth over long periods of time. However, given their smaller sizes, these companies are not well discovered, owing to lower institutional holdings and lower analyst coverage. Rigorous framework-based screening coupled with extensive bottom-up due diligence led us to a concentrated portfolio of 15-16 emerging giants.
Exhibit 19: Ambit Emerging Giants Portfolio point-to-point performance
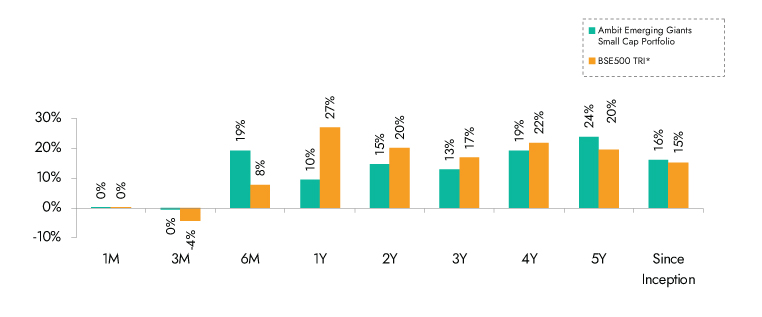
Source: Ambit Emerging Giants Small cap Portfolio inception date is Dec 1, 2017;**1M Return: 1st - 30th Nov'24; 3M Return: 1st Sep'24 – 30th Nov'24; 6M Return: 1st Jun'24 – 30th Nov'24; 1Y Return: 1st Dec'23 – 30th Nov'24 *BSE 500 TRI is the selected benchmark for the Ambit Emerging Giants Small cap. The same is reported to SEBI.
Exhibit 20: Ambit Emerging Giants Portfolio calendar year performance
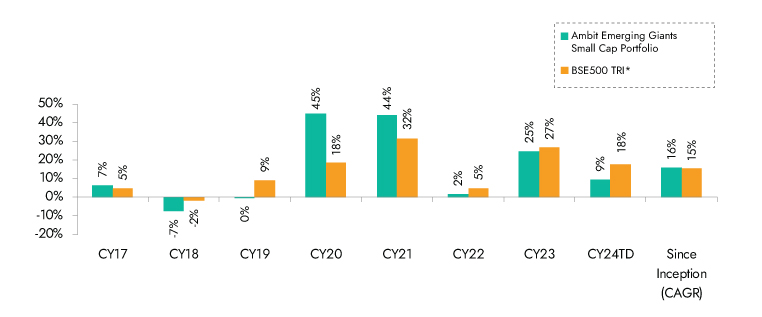
Source: Ambit Emerging Giants Small cap Portfolio inception date is Dec 1, 2017; *BSE 500 TRI is the selected benchmark for the Ambit Emerging Giants Small cap. The same is reported to SEBI.
Ambit TenX Portfolio
Ambit TenX Portfolio allows investors to participate in the India growth story as the Indian GDP heads towards a US $10 tn mark over the next 12-15 years. Medium and smaller corporates are expected to be the key beneficiaries of this growth. The portfolio intends to capitalize on this opportunity by identifying and investing in primarily mid & small cap companies that can grow their earnings 10x over the same period implying 18-21% CAGR.
Key features of this portfolio would be as follows:
- Longer-term approach with a concentrated portfolio: Ideal investment duration of more than five years with 15-20 stocks.
- Key driving factors: Low penetration, strong leadership and light balance sheet
- Forward-looking approach: Relying less on historical performance and more on future potential while not deviating away from the Good & Clean philosophy.
- No Key-man risk: Process is the Fund Manager
Exhibit 21: Ambit TenX Portfolio point-to-point performance
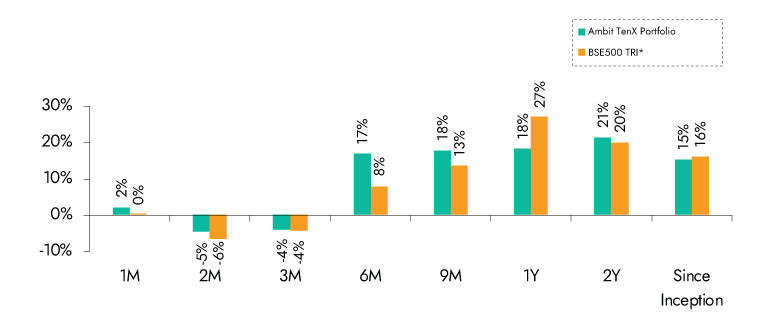
Source: Ambit TenX Portfolio inception date is Dec 13, 2021;**1M Return: 1st - 30th Nov'24; 3M Return: 1st Sep'24 – 30th Nov'24; 6M Return: 1st Jun'24 – 30th Nov'24; 1Y Return: 1st Dec'23 – 30th Nov'24 *BSE 500 TRI is the selected benchmark for the Ambit Emerging Giants Small cap. The same is reported to SEBI.
Exhibit 22: Ambit TenX Portfolio calendar year performance
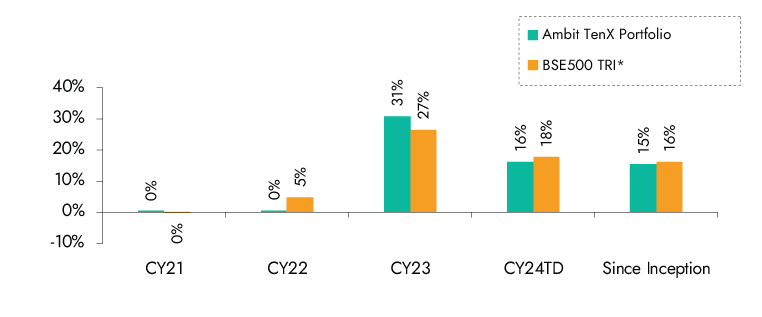
Ambit TenX Portfolio inception date is Dec 13, 2021; *BSE 500 TRI is the selected benchmark for the Ambit TenX Portfolio. The same is reported to SEBI.