
This should benefit Ambit Asset Management’s distinctive bottom-up investment style, which is marked by focus on pricing power plays. In this note we have summarized the key takeaways from a Bloomberg research note “Pricing Power Everywhere” and also applied the methodology to Indian markets. The key objective of the summary is highlighting the effectiveness of a single quantitative data point, Gross Profit Margin (GPM), as a lead indicator for superior returns and identifying pricing power plays. Despite its robustness, GPM has its own limitations. In our pricing power model, we address that by assigning around 30% weight to our quantitative frameworks (four key ratios, highest weightage to GPM) and around 70% weight to our qualitative frameworks (five key measures). In our forthcoming newsletters, we plan to discuss our other qualitative and quantitative frameworks. In this newsletter, we discuss the following: 1) Acceleration of reversal of style anomaly and 2) Stability of GPM as a measure of pricing power.
Acceleration of reversal of style anomaly
During FY21-1HFY25, the market was characterized by high beta, risk-on sentiments, and a retail-led broad-based SMID-driven rally. During such high beta bull cycles, disciplined long-term investing style and investing principles go out of favour. Short-termism and greed prevail. There is a rush to go down the quality curve and take higher risks. Sustained, low volatility and shallow drawdowns lull investors into underestimating risks and being prepared for ‘Black Swans’. This sets the stage for a market shakeout and eventual manifestation of the No.1 risk, which is permanent capital loss. This investor behaviour is what causes investment style cycles. If one were to go into history for similar divergences, the periods with such divergence would be FY91-94, FY98-00 and FY04-07.
This rally has been driven in the backdrop of high relative earnings growth for mid and small-caps and improving fundamentals. Nonetheless, the majority of the industries/sub-segments which led this rally over FY21 to 1HFY25 were cyclical, had low return ratios and lacked a history of sustainable wealth creation. This reversal of style anomaly and excesses is now accelerating. History shows that ‘compounders’, which exhibit strong franchise durability, high cash flow generation, low capital intensity and unlevered balance sheets, have delivered superior risk-adjusted returns across economic cycles. Over the past month, Nifty has corrected less than mid-caps and small-caps, which is in line with empirical evidence suggesting that large-caps and heavyweights outperform in periods of rising concentration.
Exhibit: 1 Reversal of post COVID style anomaly
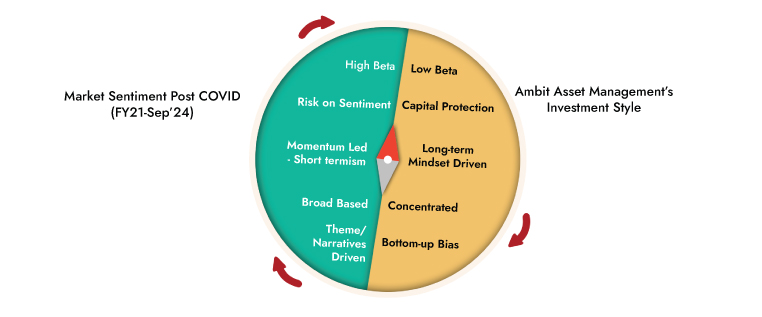
Source: Ambit Asset Management
Exhibit 2:Market concentration at all-time low and reversing
Denote CAGR returns during periods for Nifty 50, Midcap 100 and Smallcap 100 (CAGR %)

Source: Bloomberg, Ambit Capital Research, Ambit Asset Management
A stock-picker's market
With earnings growth trajectory normalising, we expect CY25 to be a stock-picker’s market. Market breadth has been narrowing over the past two quarters, with rising divergence between median stock and index returns and the majority of NSE500 stocks delivered negative returns in 3QFY25. This was not the case at the start of the year when the median stock outperformed the index by 200bps in 1QFY25. Between FY21 to Sep-24, there was major variance between the performance of large, mid and small cap index (Nifty 50 CAGR 17.1%, NSE 500 CAGR 21% and NSE Small cap 250 CAGR 31%). We expect, this wide performance divergence to be unsustainable, given the narrowing earnings growth variance and relatively high valuations for the broader SMID’s. Large cap relatively are looking more attractive and stand to benefit from increasing concentration in the market.
Exhibit 3: Market breadth has been narrowing since 2QFY25...

Source:Ace Equity, Ambit Capital Research, Ambit Asset Management
Exhibit 4: …and continued to narrow in 4QFY25TD

Source:Ace Equity, Ambit Capital Research, Ambit Asset Management
2) Stability of Gross Profit Margin (GPM) as a measure of pricing power
Pricing power, or a company’s ability to raise prices and maintain profit margins amidst increasing costs or competition, is one of the most critical dimensions for evaluating the value of a business. Pricing power is one of the most frequently mentioned concepts in the business world. Since 2002, Bloomberg data shows that “pricing power” has been regularly mentioned in the transcripts of US public company earnings calls and shareholder meetings. While the term ‘pricing power’ is referenced frequently, the concept is rarely precisely defined or empirically measured. We recently came across a Bloomberg research paper, “Pricing Power Everywhere”, wherein the author Steve Huo argues for the use of ‘Stability of gross profit margins’, as a simple and robust methodology for identifying companies with pricing power. We have in this note, done a summary of the research note and applied the methodology to the Indian context for understanding perspective.
Key advantages of pricing power companies:
- Companies with pricing power can consistently maintain profit margins during economic downturns or market saturation.
- Pricing power is considered a hallmark of quality businesses with strong customer loyalty and demand, signaling to investors the underlying strength and durability of the company. These companies are quality growth companies that quietly compound in the background.
- Companies with strong pricing power can pass on variable cost increases to consumers and increase production in response to rising margins due to stronger demand. These companies have been able to raise prices to offset inflation, preserving their real earnings and shielding investors from the eroding effects of rising costs.
- Pricing power stocks have earned higher returns over the long run and as an equity factor has been shown to work across multiple global markets over the long run, across numerous sectors and even asset classes.
- The ability to maintain pricing power can support premium company valuations, as investors are willing to pay a higher multiple for companies with predictable and sustainable earnings growth.
Why Gross Profit Margin (GPM) is a metric for pricing power?
The Bloomberg Pricing Power Index identifies “pricing power” as the long-term stability of gross profit margins.
- When looking at a company's financial profile, gross profit margin is one of the most important metrics. A healthy gross profit margin that meets or exceeds industry benchmarks is a leading indicator of the future scalability of a business.
- Gross margins that are at or above industry benchmarks give companies the ability to reinvest in sales, marketing, and research and development which are all growth drivers. Conversely, a less-than-desirable gross profit margin is a sign of some bigger issues that need to be addressed and typically impedes growth.
- However, a low gross margin ratio does not necessarily indicate a poorly performing company. It is essential to compare ratios between companies in the same industry rather than comparing them across industries (for example, Avenue Super, Titan).
- There are three primary root causes of poor gross profit margins: Pricing issues, a suboptimal product or solution delivery model, or a commoditized offering in a mature and overcrowded market.
- GPM often most accurately captures the margin variations due to input cost changes. EBITDA or Net Profit Margin, a more commonly used measure, is more prone to manipulation or smoothening. There are too many cost items with accounting treatments that are often highly discretionary.
- Higher gross profit margins allow companies the ability to incur a higher customer acquisition cost. Being able to withstand a higher customer acquisition cost can become tremendously valuable when a company finds itself in a hyper-competitive and crowded market or when they have saturated its primary sales and marketing channels.
Pricing power stocks being expensive
Since pricing power is such a pervasive concept, there are good reasons to expect that it is already “priced in” by the market and does not offer consistent outperformance. However, companies with strong pricing power have historically earned consistently strong returns while maintaining a lower risk profile. Moreover, they have demonstrated similar characteristics across different geographical markets, lending credence to the long-run reliability of pricing power as an investment factor.
Exhibit 5: Over 15 years BPPUS index has outperformed the UTS index in most up and down years
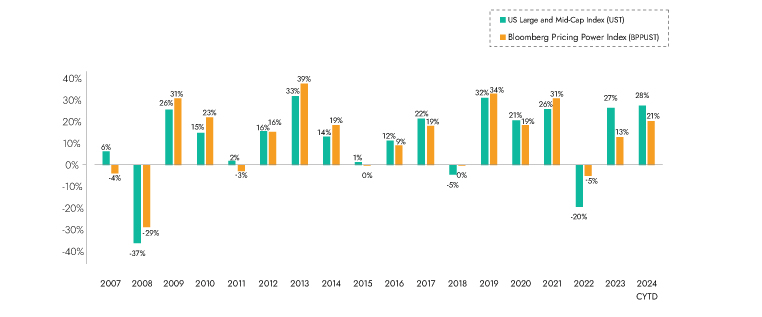
Annual performance of the bloomberg pricing power index (BBPUST) versus the bloomberg US large and mid-cap index (UST)
Source: Bloomberg, Ambit Asset Management
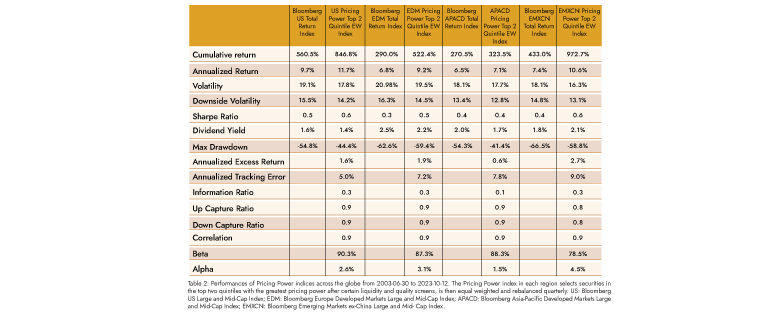
Portfolios based on pricing power stocks outperform globally
Pricing power companies tend to be less glamorous and newsworthy (exceptions when at early life cycle) but are quiet and stable quality “compounders”. As a novel equity factor, pricing power has outperformed the market not just during inflationary episodes but steadily over the long run across the globe. In a Bloomberg research paper titled ‘Pricing Power Everywhere’, Steve Hou identified that US public companies with excellent pricing power have historically delivered strong and steady equity returns with lower risk and highe returns than the broad equity market benchmark index over the last 15 years*.
Methodology for calculating the “Bloomberg Pricing Power Index”
The Bloomberg Pricing Power Index identifies “pricing power” as the long-term stability of gross profit margins. It follows a simple three steps: 1) Identifying an investment universe, 2) company selection and 3) Selecting Top 50 companies with lowest standard deviation. Bloomberg has the following equal weighted 50 stock Index based on its pricing power methodology across global markets: 1.) Bloomberg US Large and Mid-Cap Index or US Index, 2.) Bloomberg European Developed Markets Large and Mid-Cap Index or EDM Index, 3.) Bloomberg APAC Developed Markets Large and Mid-Cap Index or APACD Index, 4.) Bloomberg Emerging Markets ex-China Large and Mid-Cap Index or EMXCN Index.
Exhibit 6: Methodology for calculating the “Bloomberg Pricing Power Index”
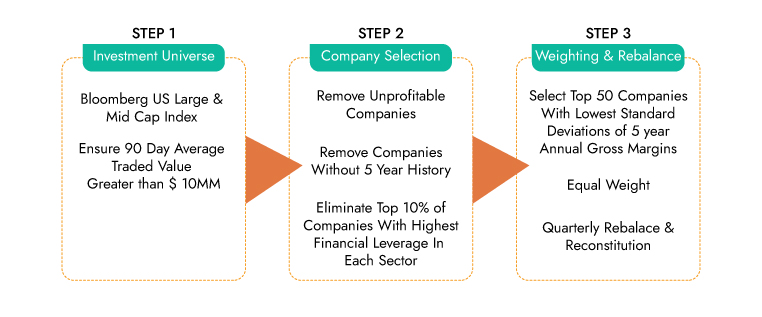
Source: Bloomberg Pricing Power Everywhere paper; Bloomberg has the following Index based on pricing power across global markets: 1. Bloomberg US Large and Mid-Cap Index or US Index, 2. Bloomberg European Developed Markets Large and Mid-Cap Index or EDM Index, 3. Bloomberg APAC Developed Markets Large and Mid-Cap Index or APACD Index, 4. Bloomberg Emerging Markets ex-China Large and Mid-Cap Index or EMXCN Index, Ambit Asset Management
Exhibit 7: Top 10 Pricing Power Companies Reoccurring with Highest Frequency Since Index Inception in Bloomberg Pricing Power Index
1738908224864.jpg)
Source:Bloomberg;Ambit Asset Management
Applying Bloomberg Pricing Power methodology to Indian Markets
We applied the Bloomberg Pricing Power methodology to Indian markets, to study its effectiveness in the Indian context. This tool is helpful in identifying 1) sectors to focus on or to avoid and 2) identifying a few quality companies across industries that sustainably compound in the background. We have conducted the study for three periods – FY23, FY24 and FY25LTM. The table below is the list of the Top 50 companies, across these periods.
Key Takeaways from the study results:
- The Top 50 companies with the lowest GPM standard deviation present a promising list of quality companies across diversified sectors and underappreciated businesses to conduct more thorough bottom-up research.
- Majority of the companies in the Top 50, even in the Indian context, are from the healthcare and industrial sectors (FY25 LTM – 14 healthcare stocks and 11 industrials stocks). The market cap wise breakup for FY25 LTM stood at 10 stocks from large cap, 13 stocks
- from mid-cap and 27 stocks from small cap.
- There are 17 companies which appear for the first time in FY25LTM. Key ones being ITC, Poly Medicure, Oracle Fin, Crisil, Kfin, SKF, Metro and JSW Infra.
- The average ROE of the Top 50 companies (FY25LTM) is ~24.5%, while the average GPM is 55%. Almost 30 companies found repeat in all three periods we have covered. The average ROE, GPM and 5years absolute stock returns of companies recurring in the list for >2 years is much higher.
- The aggregate results for the Top 50 stocks in the Indian markets, under the Bloomberg Pricing Power methodology, also yield a strong outperformance over FY00-25. The total absolute 5 year returns for FY25LTM, for the list of Top 50 stocks under this methodology is 354%, vs 91% for NIFTY 50 and 115% NSE 500 Index. Except for 11 companies in FY25LTM Top 50 list, all other stocks have outperformed the NSE 50 and NSE 500 Index on 5years absolute total returns.
Exhibit 8:Distribution of Companies across sectors and market capitalization over FY23-FY25LTM
1738908231918.jpg)
*LTM (Last twelve months) as on 23/1/2025
Source: Bloomberg, Ambit Asset Management
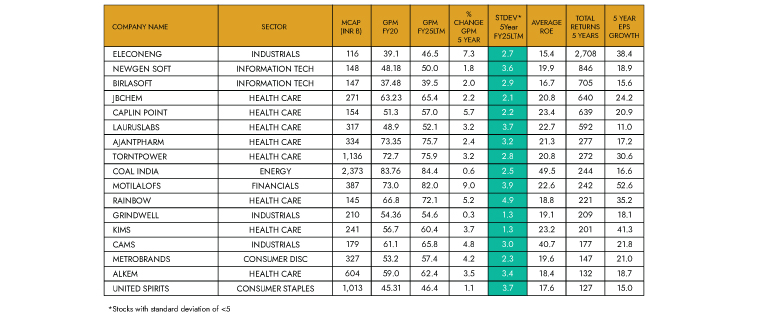
Applying the Bloomberg Pricing Power Methodology to identify the Top 50 Indian companies
- The exhibit below depicts the Top 50 stocks with lowest standard deviation for Indian stocks above Rs100b market capitalization, post all adjustments (five year data, removal of loss making and lending BFSI companies and ROE adjustment) under the methodology.
- We have conducted this study for three periods FY23, FY24 and FY25 LTM (Last twelve months)
- We have marked companies appearing in all three years, twice and only once in separate colours, as depicted in the exhibit below.
- We have broken the results across sector-wise, market cap wise, ROE and total absolute returns for the Top 50 stocks.
Exhibit 9: Results of GPM study on Indian stocks (for FY23, FY24 and LTM)
1738908240130.jpg)
Source: Ambit Asset Management / Bloomberg/ Ambit Capital Research
Exhibit 10: Top 15 Pricing Power Companies Reoccurring with Highest Frequency over FY23-FY25LTM
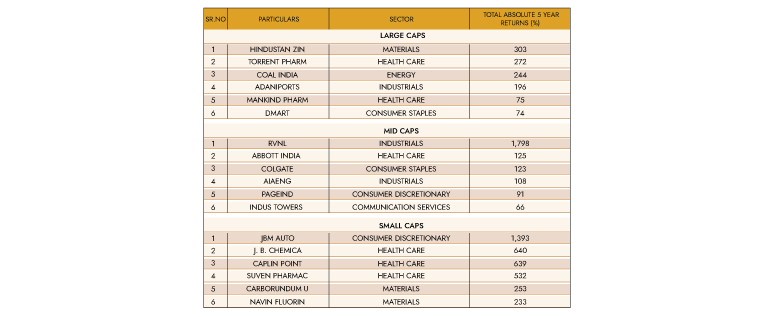
Note: 1) Exercise for FY23/ FY24 and LTM with stock universe >Rs100b; 2) Financials; REITS, Exchanges and Utilities having no material cost eliminated; 3) Loss making
stocks excluded; Average 5 year ROE >10%; *Newly listed stocks Total 5 Year Returns from listing date.
Source: Bloomberg, Ambit Asset Management
Exclusion due to increasing margins a key drawback
While sorting for Top 50 companies with lowest standard deviation for GPM, few companies with stable but increasing margins also end up getting excluded from the Top 50 list, due to higher standard deviation. While exclusion due to temporary cyclical reasons could be justified, there could be genuine cases where GPM is structurally increasing due to changing product mix, superior competitive positioning etc., which under this methodology gets eliminated. The table below depicts a list of few such companies for FY25LTM, which performance wise on a Total 5 Year returns have done
significantly better 493% returns vs 115% for Nifty500. This methodology of relying only on one key quantitative criteria also has other drawbacks such as it fails to identify young new economy plays, fallen angels/ turnarounds and bottom up cyclical/ seasonal but quality plays (airlines).
Exhibit 11: List of companies which missed out from the top 50 short list due to increase in margins
Source: Bloomberg, Ambit Asset Management
Conclusion
- This post-COVID market anomaly and excesses have been exhibiting signs of reversal and are now accelerating.
- When looking at a company's financial profile, gross profit margin is one of the most important metrics. A healthy gross profit margin that meets or exceeds industry benchmarks is a leading indicator of superior market returns and scalability of a business.
- We have a quantitative and qualitative framework fro identifying pricing power plays. We assign around 30% weight to our quantitative frameworks (four key ratios) and around 70% weight to our qualitative frameworks (five key measures). Amongst the quantitative factors, gross profit margin stability carries the highest weight.
- Ambit Asset Management focuses on identifying companies with increasing pricing power, which are driving the widest wedge between customer’s willingness to pay (WTP) and supplier’s willingness to supply (WTS).
Annexure 1
Exhibit 12: Top 50 Stocks Bloomberg US Large and Mid-Cap Index
1738908261543.jpg)
Source: Bloomberg; Ambit Asset Management
Annexure 2
Exhibit 13: Extract from Bloomberg research paper ‘Pricing Power Everywhere’ 2007-2023
Source: Bloomberg; Ambit Asset Management
AMBIT COFFEE CAN PORTFOLIO
At Coffee Can Portfolio, we do not attempt to time commodity/investment cycles or political outcomes and prefer resilient franchises in the retail and consumption-oriented sectors. The Coffee Can philosophy has an unwavering commitment to companies that have consistently sustained their competitive advantages in core businesses despite being faced with disruptions at regular intervals. As the industry evolves or is faced with disruptions, these competitive advantages enable such companies to grow their market shares and deliver long-term earnings growth.
Exhibit 14: Ambit’s Coffee Can Portfolio point-to-point performance
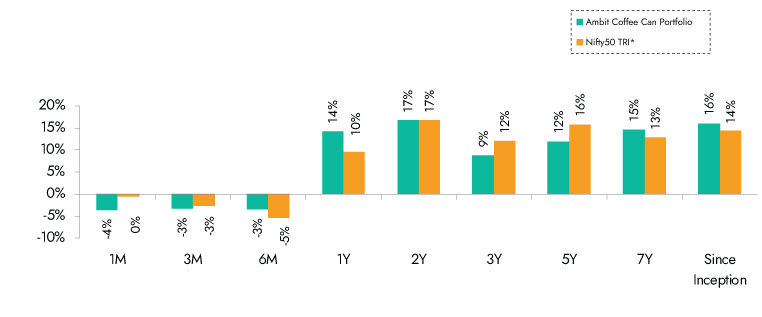
Source: Ambit Coffee Can Portfolio inception date is Mar 06, 2017;**1M Return: 1st - 31st Jan'25; 3M Return: 1st Nov'24 – 31st Jan'25; 6M Return: 1st Aug'24 – 31st Jan'25; 1Y Return: 1st Feb'24 – 31st Jan'25
*Nifty 50 TRI is the selected benchmark for the Ambit Coffee Can Portfolio. The same is reported to SEBI.
Exhibit 15: Ambit’s Coffee Can Portfolio calendar year performance
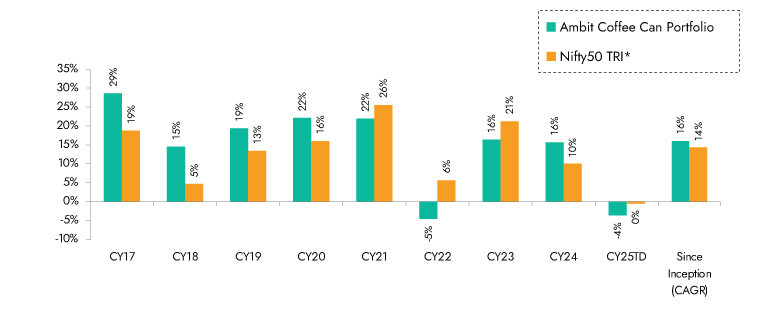
Ambit Coffee Can Portfolio inception date is Mar 06, 2017; *Nifty 50 TRI is the selected benchmark for the Ambit Coffee Can Portfolio. The same is reported to SEBI.
Ambit Good & Clean Midcap Portfolio
Ambit's Good & Clean strategy provides long-only equity exposure to Indian businesses that have an impeccable track record of clean accounting, good governance, and efficient capital allocation. Ambit’s proprietary ‘forensic accounting’ framework helps weed out firms with poor quality accounts, while our proprietary ‘greatness’ framework helps identify efficient capital allocators with a holistic approach for consistent growth. Our focus has been to deliver superior risk-adjusted returns with as much focus on lower portfolio drawdown as on return generation. Some salient features of the Good & Clean strategy are as follows:
- Process-oriented approach to investing: Typically starting at the largest 500 Indian companies, Ambit's proprietary frameworks for assessing accounting quality and efficacy of capital allocation help narrow down the investible universe to a much smaller subset. This shorter universe is then evaluated on bottom-up fundamentals to create a concentrated portfolio of no more than 20 companies at any time.
- Long-term horizon and low churn: Our holding horizons for investee companies are 3-5 years and even longer with annual churn not exceeding 20-25% in a year. The long-term orientation essentially means investing in companies that have the potential to sustainably compound earnings, with these compounding earnings acting as the primary driver of investment returns over long periods.
- Low drawdowns: The focus on clean accounting and governance, prudent capital allocation, and structural earnings compounding allow participation in long-term return generation while also ensuring low drawdowns in periods of equity market declines.
Exhibit 16: Ambit’s Good & Clean Midcap Portfolio point-to-point performance
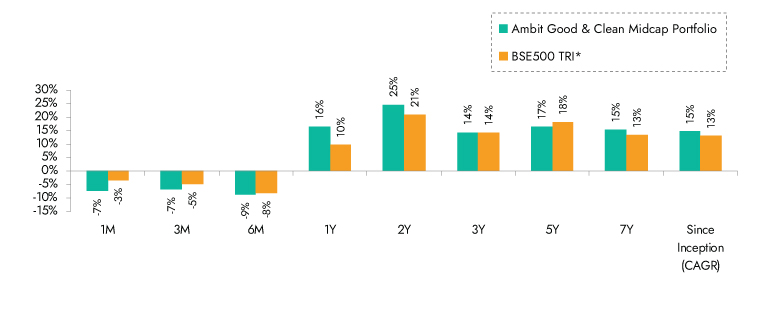
Source: Ambit Good & Clean Mid cap Portfolio inception date is Mar 12, 2015;**1M Return: 1st - 31st Jan'25; 3M Return: 1st Nov'24 – 31st Jan'25; 6M Return: 1st Aug'24 – 31st Jan'25; 1Y Return: 1st Feb'24 – 31st Jan'25
*BSE 500 TRI is the selected benchmark for the Ambit Good & Clean Mid cap. The same is reported to SEBI.
Exhibit 17: Ambit’s Good & Clean Midcap Portfolio calendar year performance
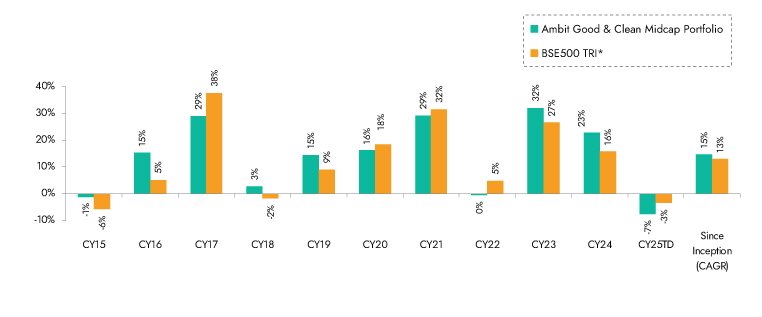
Ambit Good & Clean Mid cap Portfolio inception date is Mar 12, 2015; *BSE 500 50 TRI is the selected benchmark for the Ambit Good & Clean Mid cap. The same is reported to SEBI.
Ambit Emerging Giants Small Cap Portfolio
Small caps with secular growth, superior return ratios and no leverage are the essence of Ambit's Emerging Giants portfolio. The portfolio aims to invest in small-cap companies with market-dominating franchises and a track record of clean accounting, governance and capital allocation. The fund typically invests in companies with market caps less than INR 10,000 cr. These companies have excellent financial track records, superior underlying fundamentals (high RoCE, low debt), and the ability to deliver healthy earnings growth over long periods of time. However, given their smaller sizes, these companies are not well discovered, owing to lower institutional holdings and lower analyst coverage. Rigorous framework-based screening coupled with extensive bottom-up due diligence led us to a concentrated portfolio of 18-20 emerging giants.
Exhibit 18: Ambit Emerging Giants Portfolio point-to-point performance
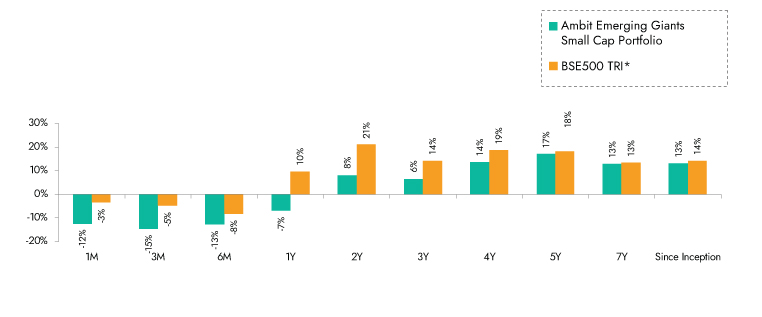
Source: Ambit Emerging Giants Small cap Portfolio inception date is Dec 1, 2017;**1M Return: 1st - 31st Jan'25; 3M Return: 1st Nov'24 – 31st Jan'25; 6M Return: 1st Aug'24 – 31st Jan'25; 1Y Return: 1st Feb'24 – 31st Jan'25
*BSE 500 TRI is the selected benchmark for the Ambit Emerging Giants Small cap. The same is reported to SEBI.
Exhibit 19: Ambit Emerging Giants Portfolio calendar year performance
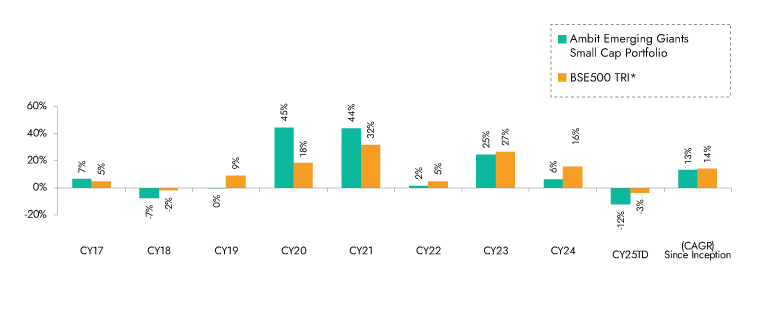
Source: Ambit Emerging Giants Small cap Portfolio inception date is Dec 1, 2017; *BSE 500 TRI is the selected benchmark for the Ambit Emerging Giants Small cap. The same is reported to SEBI.
Ambit TenX Portfolio
Ambit TenX Portfolio allows investors to participate in the India growth story as the Indian GDP heads towards a US $10 tn mark over the next 12-15 years. Medium and smaller corporates are expected to be the key beneficiaries of this growth. The portfolio intends to capitalize on this opportunity by identifying and investing in primarily mid & small cap companies that can grow their earnings 10x over the same period implying 18-21% CAGR.
Key features of this portfolio would be as follows:
- Longer-term approach with a concentrated portfolio: Ideal investment duration of more than five years with 15-20 stocks.
- Key driving factors: Low penetration, strong leadership and light balance sheet
- Forward-looking approach: Relying less on historical performance and more on future potential while not deviating away from the Good & Clean philosophy.
Exhibit 20: Ambit TenX Portfolio point-to-point performance
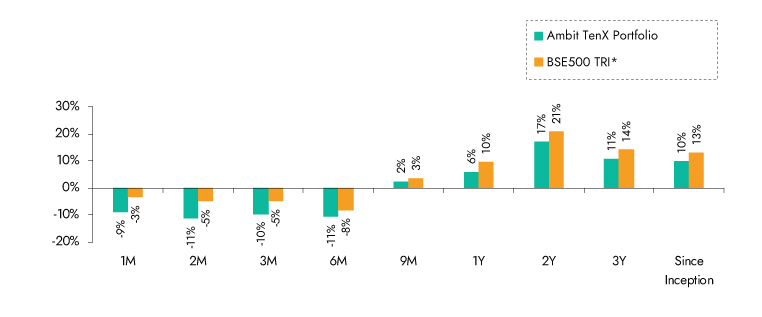
Source: Ambit TenX Portfolio inception date is Dec 13, 2021;**1M Return: 1st - 31st Jan'25; 3M Return: 1st Nov'24 – 31st Jan'25; 6M Return: 1st Aug'24 – 31st Jan'25; 1Y Return: 1st Feb'24 – 31st Jan'25
*BSE 500 TRI is the selected benchmark for the Ambit TenX Portfolio. The same is reported to SEBI.
Exhibit 21: Ambit TenX Portfolio calendar year performance
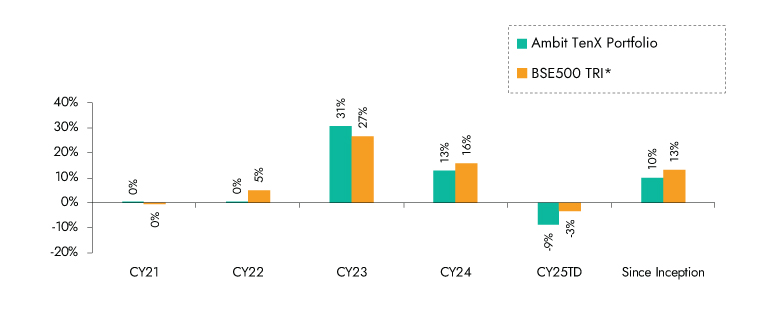
Ambit TenX Portfolio inception date is Dec 13, 2021; *BSE 500 TRI is the selected benchmark for the Ambit TenX Portfolio. The same is reported to SEBI.
Ambit Micro Marvels Portfolio
We aim to create a portfolio that invests predominantly in micro-cap companies with the potential of delivering superior earnings growth and generating relatively better risk-adjusted performance over a long period of time.
Ambit’s proprietary ‘forensic accounting’ framework helps weed out firms with poor quality accounts while our proprietary ‘greatness’ framework helps identify efficient capital allocators. The result is a concentrated portfolio of 20-25 stocks that draws down less than the market in corrections and has low churn.
Key Features of Portfolio Companies:
1. High earnings growth companies with low leverage,
2. Market leaders or challengers with strong moat around brand, distribution, technology, and innovation,
3. Strong corporate governance coupled with apt capital allocation.
Exhibit 22: Ambit Micro Marvels Portfolio point to point performance
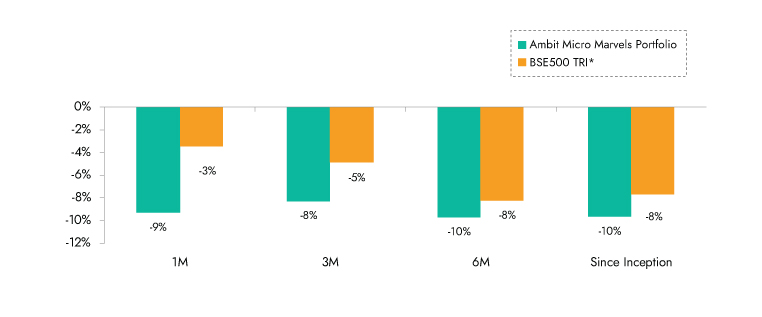
Source: Ambit Micro Marvels Portfolio inception date is Jul 29, 2024;**1M Return: 1st - 31st Jan'25; 3M Return: 1st Nov'24 – 31st Jan'25; 6M Return: 1st Aug'24 – 31st Jan'25; 1Y Return: 1st Feb'24 – 31st Jan'25
*BSE 500 TRI is the selected benchmark for the Ambit Micro Marvels Portfolio. The same is reported to SEBI.
.
Exhibit 23: Ambit Micro Marvels Portfolio point to point performance
1738845028584.jpg)
Source: Ambit Micro Marvels Portfolio inception date is Jul 29, 2024;
*BSE 500 TRI is the selected benchmark for the Ambit Micro Marvels Portfolio. The same is reported to SEBI.