
Traditional models are under pressure from agile, experience-led, and digital-first players. At the same time, disruption is catalyzing growth in segments such as lab-grown diamonds, premium direct-to-consumer (D2C) brands, and curated consumption platforms that are reshaping value chains and consumer expectations. This dual impact underscores a structural transformation in how demand is created, captured, and sustained.
Business cycles have started shortening, led by rising technological disruptions
Our interaction with several business communities suggests that business cycles across sectors have started shrinking significantly compared to a decade ago, led by several variables. Traditional business cycles (expansion → peak → recession → recovery) used to last for many years earlier, but are no longer. These changes are led by technological disruptions, changing consumer behavior, re-alignment of supply chains, and geopolitical events.
Changing consumer behavior patterns: Quick Commerce is fast changing consumer behavior patterns in a major way. Consumers now opt for instant gratification led by quick delivery (10-20 mins) for groceries, essentials and now even luxury goods. With the convenience of speed, consumers are reducing brand loyalty as speed seems to be outweighing brand preference. Quantum of purchases is also frequent nowadays as opposed to once a month earlier and small ticket now vs bulk earlier, led by the convenience of delivery at the doorstep.
Realignment of supply chain: The recent tariff announcement by the US is likely to cause a significant disruption to the existing supply chain. Higher tariffs on China, Vietnam and Bangladesh, which have significant exposure to US exports, are likely to have an impact as businesses re-evaluate their supply chain sourcing to alternate countries like India or even back to the US (reshoring). This realignment isn't smooth — it causes delays, higher setup costs, supplier shortages, and logistics bottlenecks in the short term. Several industries like textile, auto components, electronics, consumer durables are vulnerable as they rely on complex, globally distributed supply networks.
Technological disruption: The IT services sector is a prime example of technological disruptions. The need for large human teams is reducing, led by (a) several Artificial Intelligence (AI) tools which are automating manual coding, testing and system maintenance and (b) generative AI tools like GitHub Copilot, ChatGPT, accelerating software development, code generation, bug fixes and documentation. Likewise, Cloud platforms with AI-driven optimization are reducing the need for traditional infrastructure management roles.
Geo-political events: Several geo-political events like wars, national security concerns, energy transition, new alliances are creating disruptions. The Russia-Ukraine war and the Middle East conflicts are disrupting supply chains across energy, food, metals. National security concerns around data security and technology bans are splitting global markets into regional blocs - GDPR in Europe, China’s Cybersecurity Law, India's data protection regulations require companies to store and process data within national or regional borders. Energy transitions are disrupting traditional industries like oil and gas while creating pressure on new minerals like (a) lithium, cobalt, nickel for EVs and battery storage; (b) neodymium and dysprosium for wind turbines, EV motors and advanced electronics; (c) copper for renewable energy grid and electric infrastructure.
Instances of disruptions
1. Quick Commerce disrupting the general trade
India’s FMCG and general trade ecosystem, long dominated by kirana stores and deep distribution networks, is being rapidly transformed by Quick Commerce. Platforms like Blinkit, Zepto, and Instamart offer 10–30-minute deliveries, appealing to digitally savvy, time-pressed urban consumers. This shift prioritizes speed and convenience over brand loyalty or concentrated purchases. Enabled by UPI, smartphones, and urban density, Q-commerce is steadily eroding the dominance of traditional general trade. As consumer behavior evolves, FMCG brands are rethinking their distribution strategies through hybrid and tech-driven models.
Exhibit 1: Evolution of retail in India
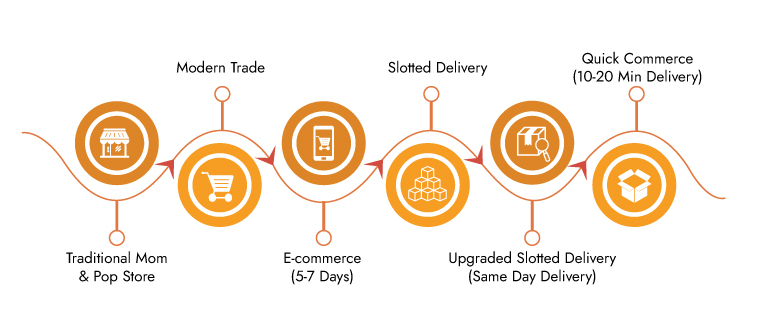
Source: Redseer Research, Ambit Asset Management
Share of Quick Commerce has expanded rapidly and could be sustained by improving economics
Quick Commerce (QC) has seen exponential growth in India, reaching an annual Gross Order Value (GOV) of US$ 4 billion within just four years of launch. This remarkable traction is underpinned by its compelling value proposition: near-instant delivery, curated assortment across multiple categories, and a seamless user experience. The segment has moved beyond its early perception of being a convenience-led, cash-burning model to a more structurally sound and economically viable business. What began as a solution for emergency or top-up purchases is now seeing habitual usage, with higher order frequencies and increasing average order values (AOVs).
Despite its early success, QC accounts for only 6% of India’s estimated US$ 63 bn total addressable market (TAM), highlighting significant headroom for growth. TAM is expected to grow at a 22% CAGR over FY24–30E, while QC GOV is projected to rise at a 36% CAGR to reach US$ 25 bn by FY30E. This growth will be driven by deeper penetration, expansion into new categories (beyond food and grocery), and increasing relevance in Tier-1 cities.
Improving unit economics is at the heart of this sustainability story. Platforms like Blinkit have scaled from 385 dark stores in FY23 to 1301 in FY25, streamlined assortments to favor high-margin SKUs, and enhanced delivery efficiencies. Additionally, cost structures have improved through reduced discounts, hyperlocal logistics, and better order density. Strategic synergies with parent platforms (e.g., Zomato) further reduce customer acquisition costs, reinforcing the positive trajectory of QC economics and enabling a long runway for profitable growth.
Exhibit 2: Trend in Blinkit GOV annualised (US$ bn) Exhibit 3: Store additions by Blinkit accelerated in the last year, the store count reaching 1.3k in 4Q FY25
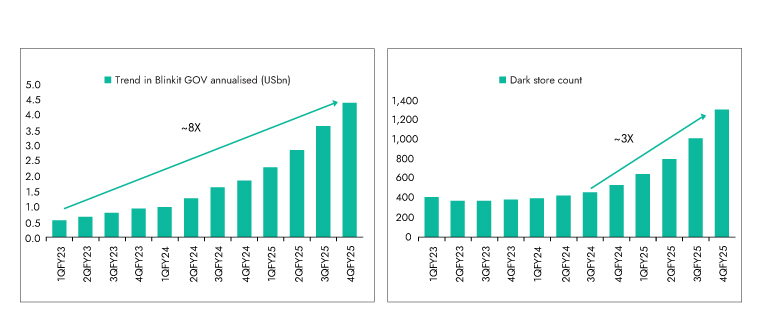
Source: Company, Ambit Asset Management
2. Electric vehicles are disrupting internal combustion vehicles
India’s electric vehicle (EV) sector has undergone a remarkable transformation over the past few years and has become central to the country’s mobility strategy. The shift spans across all major vehicle categories- from two-wheelers (2Ws) and three-wheelers (3Ws) to four-wheelers (4Ws) and buses. EV penetration has grown nearly 4x over the past three years, highlighting strong consumer acceptance and policy support. The 2W segment has led India’s EV transition, with EVs accounting for nearly 13% of total scooter sales in FY25 vs 3% in FY22. This segment has seen the fastest transition due to affordability; primary use is short intra-city trips (no range anxiety) and low cost of ownership. Companies like TVS Motors, Bajaj Auto, Ola, Ather, Hero, etc. have introduced high-speed, lithium-ion powered scooters with a range of 100-150 km per charge along with advanced features such as smartphone integration, GPS tracking, and over-the-air updates, which make these scooters further attractive. We believe there are more legs to this growth, given the penetration of 2Ws in China, which is globally leading in EV, is at 35% in 2023.
Exhibit 4: EV penetration in scooters
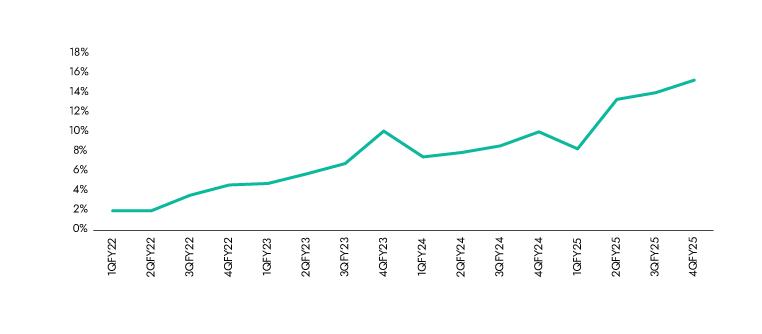
Source: Company , Ambit Asset Management
Another key beneficiary of electrification is the 3W segment; EV penetration herein has reached ~30% thanks to their strong business case for drivers and fleet operators. E-rickshaws often run short fixed urban route distances, which makes EVs the economical choice.
The launch of mass market models across the 4W space will drive the electrification of 44W in India. Currently the penetration in 4W’s is at ~3%; however, we believe this will grow multifold increase driven by reduced cost of battery (reduced by ~ 60% in last 7 years), increasing charging infrastructure (1,800 EV charging stations as on Feb,22 have increased to 25,502 as of Dec’24), continued government support (subsidy) and falling total cost of ownership especially for high usage customers such as fleet operators.
E-buses have transformed Urban Transport: India’s transition to electric buses has been spearheaded by government procurement (STUs). Another important point to note is that buses run on predictable schedules along fixed routes, charging times can be planned according to a bus schedule. Over the long run, electric buses make economic sense - the TCO (Total Cost of Ownership) for AC e-buses is nearly 15-20% lower than AC diesel buses over 12 years, thus making e-buses an attractive proposition. A further big driver in this has been the “Gross Cost Contract”- In this model, STUs don’t buy buses on their books. Instead, they lease them from private operators or from the Original Equipment Manufacturers (OEMs) themselves, who manage everything from purchase to maintenance. Pay per use model significantly reduce financial pressure on STUs.
Why we believe this growth is sustainable:
- Declining battery prices and increased local manufacturing: Battery costs have reduced considerably over the past years. Battery cost typically represents 30-40% of the total cost of an electric vehicle and hence reduced costs make the vehicle economically viable.
Exhibit 5: Falling lithium prices of batteries
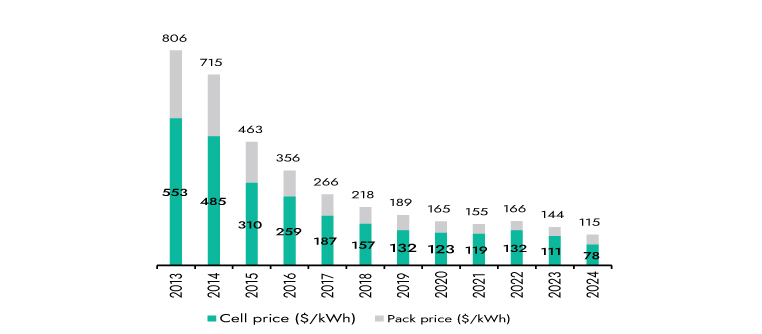
Source: Company , Ambit Asset Management
- A strong government push: - In 2025, the Indian government is promoting electric mobility through the “PM Electric Drive Revolution in Innovative Vehicle Enhancement” (PM E-drive). The scheme provides for a Rs. 2,500 per kwh battery capacity incentive for e-2Ws (up to Rs. 5,000) and e-3Ws (e-rickshaws and e-carts). Further, it also grants for creating capital assets, such as charging infrastructure (Ministry of Heavy Industries may grant an 80% subsidy on the setup cost for behind-the-meter infrastructure required for setting up public fast charging stations). The scheme also supports EV manufacturing in India through the Phased Manufacturing Programme (PMP), which encourages domestic production.
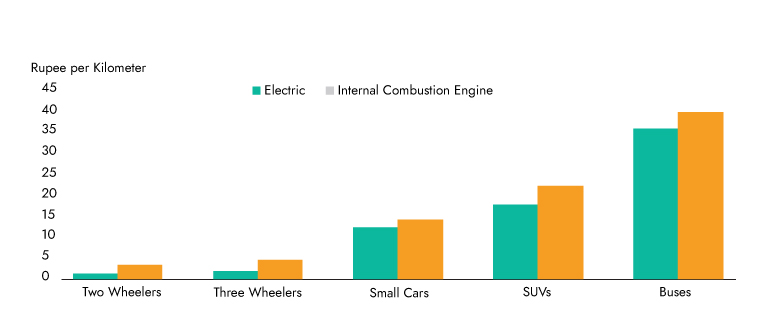
- Lower TCO during the lifecycle of the product: - The Total Cost of Ownership (TCO) for electric vehicles (EVs) is generally lower than for internal combustion engine (ICE) vehicles over the vehicle's lifetime, despite the upfront cost of EVs being higher. The cost savings are the highest for 2Ws (~60%) and the lowest for Small Cars (~7%). Lower Fuel/Energy Costs, Lower maintenance costs and Incentive and Tax Credits make EVs economically viable.
Exhibit 6:Total cost of ownership of battery electric vs combustion engine vehicles by segments
Source: Bloomberg NEF , Ambit Asset Management
3. Lab-Grown Diamonds disrupting natural diamonds?
Lab-grown diamonds (LGDs) are chemically, physically, and optically identical to natural diamonds. They are created using advanced technological processes—primarily Chemical Vapour Deposition (CVD) or High-Pressure High Temperature (HPHT)—that replicate the natural conditions under which diamonds form in the earth. Unlike synthetic stones such as cubic zirconia or Moissanite, lab-grown diamonds are real diamonds. The primary difference lies in the origin: natural diamonds are mined from the earth, while LGDs are grown in controlled lab environments.
China (45%) and India (35%) are the leading producers of LGDs, together contributing an estimated ~80% of the LGD volume. India ranked first in exports of LGDs, with a share of 29% of the world’s exports.
Exhibit 7: Natural Diamonds (ND) and Lab grown diamonds (LGD) comparison
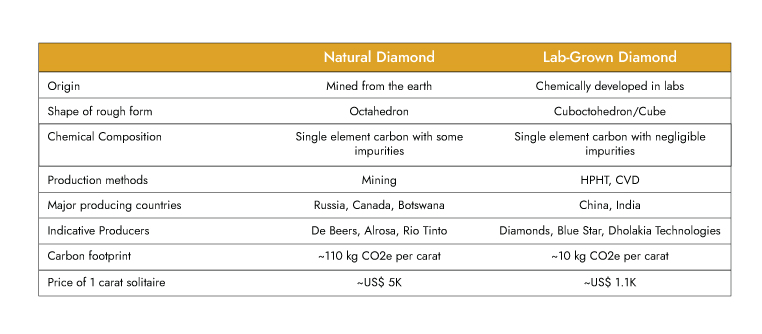
Source: Redseer research and analysis, Morgan Stanley Report, Ambit Asset Management
In CY23, global cut and polished diamonds (CPD) demand for jewelry was ~34 mn carats, with ~28 mn natural and ~6 mn LGDs. Over CY23–28P, natural diamond supply is expected to remain flat, while LGDs are projected to grow at an ~18% CAGR.
Exhibit 8: Natural CPD production to remain flat… Exhibit 9: ..while LGD to see ~18% CAGR over CY23-28
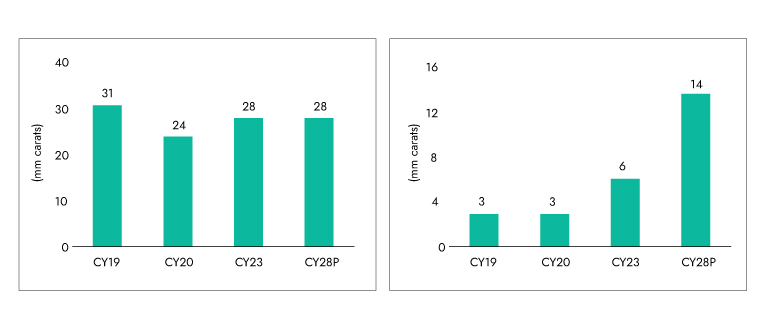
Source: Redseer, Company RHP, Ambit Asset Management
Prices trade for ND and LGD (US$/carat)
Exhibit 10: Natural diamond prices Exhibit 11:LGD becoming affordable
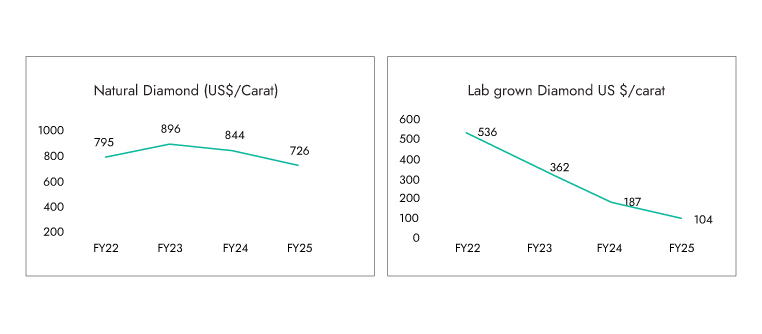
Source: Care Edge, Ambit Asset Management
Several advantages of lab-grown diamonds make us believe this will disrupt natural diamonds
Multiple SKUs: LGDs can be produced with precision across various sizes, cuts, and carat weights. This manufacturing control ensures better inventory management and faster turnaround for retailers. Unlike mined diamonds, where natural occurrence dictates availability, lab diamonds offer a consistent supply. This enables brands to offer a wider variety of designs and collections, targeting both premium and affordable price points.
Unique offering: Creating fancy-colored diamonds (blue, pink, yellow, etc.) is far easier in a lab than finding them in nature. This unlocks creativity and diversity in jewellery design and opens up niche, fashionable segments. Naturally colored diamonds are rare and exorbitantly priced; lab-grown variants democratize access to these aspirational products.
Wider price range: LGDs cost 50–70% less than natural diamonds, making diamond jewellery far more accessible. This affordability allows brands to target younger demographics, drive everyday wear usage, and create repeat purchase cycles—a concept historically alien to the natural diamond category.
Investment Implication of Disruptions Turning Change into Opportunity
In today’s market, disruption isn’t a passing trend, it’s a defining force. From artificial intelligence and clean energy to digital finance and biotech, transformative technologies are reshaping how industries operate, compete, and grow.
For investors, this wave of change brings both significant opportunity and heightened risk. To successfully navigate disruption, a strategic, forward-thinking approach is essential.
Here are four key principles to keep in mind:
- Take a Long-Term View
Disruptive innovation often sparks volatility. Short-term swings are common as markets adjust to new realities. Staying focused on long-term growth potential helps investors ride out turbulence and capture structural winners.
- Diversify Across Themes, Sectors, and Regions
Concentration risk can be a portfolio killer in fast-changing environments. Building exposure across multiple geographies and innovation-driven themes—such as AI, climate tech, and health tech—can enhance resilience and performance.
- Stay Informed and Adaptive
The pace of change is relentless. Ongoing research and awareness of macroeconomic shifts, technological trends, and policy developments are essential to making timely, informed investment decisions.
- Prioritize Quality and Flexibility
Not all companies are positioned to benefit from disruption. Investors should focus on firms with strong balance sheets, adaptable business models, and visionary leadership—traits that support sustainable success in dynamic markets.
Several instances of Disruption
1. IGI - High-Growth LGD opportunity backed by certification dominance
International Gemmological Institute (IGI) is the world’s second-largest independent certification and accreditation services provider for diamonds, studded jewellery and colored stones. IGI was also the first company to establish an international lab for diamond-studded jewellery and colored stone certification (in 1999). IGI is one of three players offering a full stack of comprehensive offerings among global peers. IGI has a 33% global market share (by volume). IGI had a ~65% market share in certifications of LGDs and has been a first mover in certification services for LGDs (started in 2005). In India, IGI has ~50% market share, serving nine of the top 10 jewellery chains.
IGI has built a vast international footprint, with 31 laboratories across 10 countries and 18 schools of gemology across 6 countries as of March’24. It is also one of only three global players offering a full-stack solution for certification across natural diamonds, lab-grown diamonds, colored stones, and finished jewelry.
1746702779984.jpg)
IGI’s credibility is grounded in decades of technical excellence, customer trust, and pioneering initiatives, being the first to offer certification for lab-grown diamonds globally in 2005 and the first in India in 1999. With a customer base of over 7,500 entities across the value chain, including the top Indian jewelry chains and multiple lab-grown diamond growers, IGI has cultivated enduring partnerships. Its education-driven approach, mobile labs, and co-branded offerings further reinforce its position as a trusted and innovative certification partner globally.
Key advantages of the business:
High barriers to entry: Credibility and trust are the most important drivers of market share in the certification industry. Gemological Institute of America (GIA) and IGI account for 80% of the global market given their long-term legacies and global networks. The certification business is defensive relative to the underlying diamonds. This is similar to the credit rating agencies in the lending market, where only the top 2 have the leading market share.
Exhibit 12: Global market share
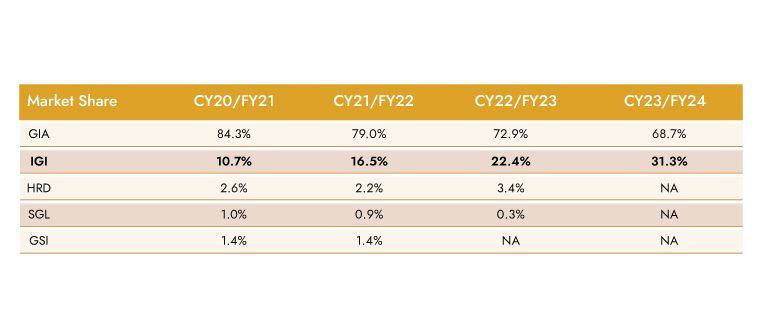
Source: DRHP, Ambit Asset Management
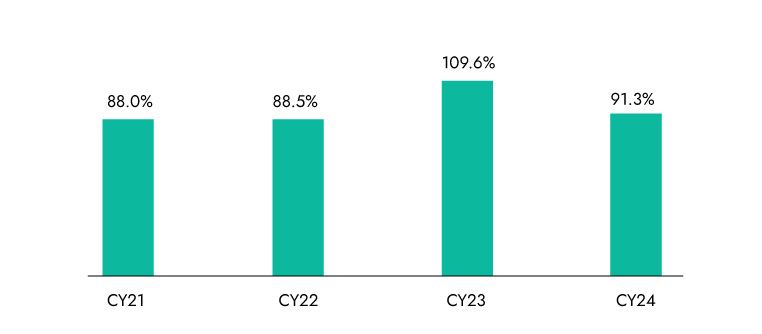
Attracting and retaining talent is the key to IGI's market position: IGI has implemented comprehensive training programs to enhance the skills of its gemologists, ensuring adherence to international grading standards. IGI laboratories are supported by 800+ gemologists (as of Mar’25), and research personnel who stay updated with technology advancements in gemology and actively participate in global programs. IGI has a rate of ~10.7% in CY24, which is one of the best in the industry, which is at ~25-30%. attrition
Expansive customer base with global reach: IGI has been driving various initiatives to maintain customer relationships through cobranded reports, in-factory laboratory set-ups, mobile laboratory set-ups, etc. It offers certification services to a diverse range of customers, like diamond growers and wholesalers (upstream), jewellery manufacturers, brands, and retailers (certification before selling) and end-consumers requesting B2C certification (downstream), either directly or through retailers. As per Redseer, IGI serves 9 of the top 10 jewellery chains in India by revenues in F24. As of Mar'25, IGI had a customer base of 7,500 across 10 countries with whom it had developed multi-year relationships, which include various brands and retailers domestically and internationally.
Asset-light model: IGI is relatively asset-light, enjoys strong operating leverage, and benefits from the network effect—more certification demand attracts more jewellery partners, which in turn generates more volumes. As the LGD ecosystem matures, IGI is well-placed to be the certification backbone, with sticky business from both manufacturers and retailers. Resultantly, the ROIC continues to be impressive at >85%
Exhibit 13: Oversupply continues to drive LGD price corrections
Source: Care Edge, Ambit Asset Management
Why do we believe penetration will rise in certification?
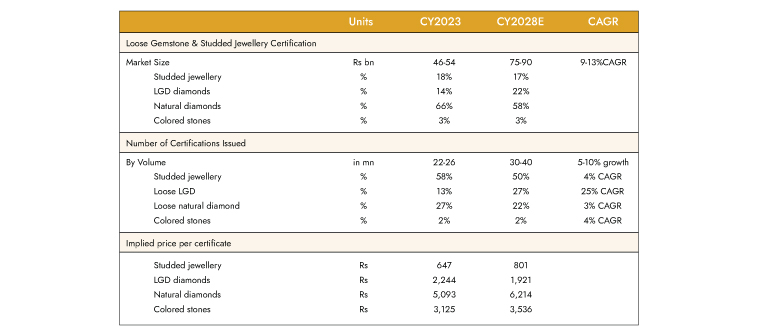
The certificates issued by volume stand at around 22-26mn and are expected to grow at a 5-10% CAGR over CY23-28, as per Redseer. In the same period, certification penetration is expected to rise from 65-70% in CY23 to 75-80% in CY28, according to Redseer, with the share of LGDs rising from 13% to 27%, growing at a 25% CAGR. Certification penetration in LGDs was 70% as of CY23, higher than naturals at 65%, as LGDs are produced in higher carat sizes and hence are more commonly certified. The certification of diamonds is part of the midstream or downstream stage.
The main drivers of the certification market are:
Increasing awareness among consumers for certification, coupled with rising sales of LGDs (70% of LGDs certified in CY23, expected to rise to 85% in CY28, as per Redseer).
When customers view jewellery as a financial asset, the certificates provide the monetary replacement value of the loose stones and jewellery.
With the growth of the second-hand diamond-studded jewellery market, certificates verify a diamond's attributes and quality.
A shift towards organized jewellery retail and the rise of D2C brands from a large unorganized market will enable higher consistency in quality and awareness of fraud and hence, in turn, the need for certification will rise.
Potential to increase certification of lower-sized diamonds remains high, with only 50% of natural diamonds under 0.5 carats being certified, vs the overall penetration of 65%. Diamonds over 0.5 carats are certified with costs under 2% of retail value as of CY23, while certification costs for smaller diamonds remain high.
For LGDs, some market players price these diamonds per piece rather than per carat, making the certification of smaller LGDs more viable. In CY 2023, ~45% of LGDs under 0.5 carats were certified, compared to ~70% overall. By CY 2028, certification for these smaller LGDs is expected to rise to ~68%.
Exhibit 14: Certification market
Source: Redseer, Company, Ambit Asset Management
2. Eternal (Zomato)
Zomato has fundamentally disrupted multiple industries, most notably food delivery, restaurant discovery, and Quick commerce, by leveraging technology, innovative business models, and aggressive expansion, reshaping consumer habits and industry dynamics.
Initially, Zomato transformed the way Indians discover and order food. By digitizing restaurant menus and reviews, it created a comprehensive platform that connected millions of users with local eateries, making dining choices more informed and accessible.
Beyond food delivery, Zomato disrupted the restaurant industry by introducing programs like Zomato Gold, which incentivized dine-in customers with exclusive deals, and by providing kitchen infrastructure to aspiring restaurateurs, thus fostering entrepreneurship and expanding the food ecosystem.
Zomato’s foray into Quick Commerce through Blinkit has shaken up the grocery and essentials delivery market. With rapid 10-15 minute deliveries, it challenged traditional retailers and smaller distributors, prompting antitrust scrutiny over alleged predatory pricing. Blinkit, now a market leader with a 41% share fundamentally altering consumer expectations and retail supply chains. This model has flattened traditional retail distribution, given brands greater visibility, and introduced competitive pricing, challenging established FMCG giants.
By integrating technology, expanding aggressively, and diversifying its offerings, Zomato has not only disrupted but also redefined the food, restaurant, and grocery delivery landscapes in India, setting new standards for convenience and operational scale.
Eternal is an E-commerce company and it’s a leading online food delivery and restaurant discovery platform in India
- Zomato's platform facilitates convenient online food ordering, user-generated reviews and ratings, and provides extensive restaurant menus, enabling customers to make informed decisions and enhance their overall dining experience.
- Hyperpure business offers a direct and reliable supply chain solution, connecting farmers with restaurants by providing high-quality, fresh raw materials necessary for their operations.
- Zomato has introduced the Zomato Gold membership program, offering exclusive benefits such as discounts and complimentary dishes at partnered restaurants, adding value and enhanced experiences for its subscribers.
- In 2022, Zomato acquired Grofers and rebranded it as Blink-It. Blink-It operates as a quick-commerce service provider, offering rapid delivery of groceries, fresh produce, meat, bakery items, personal care products, baby care items, pet care products, snacks and more within 10 minutes.
Exhibit 15: Zomato GOV (B2C Business) CAGR 44% Exhibit 16: Zomato's revenue grew 44% CAGR in 5 years
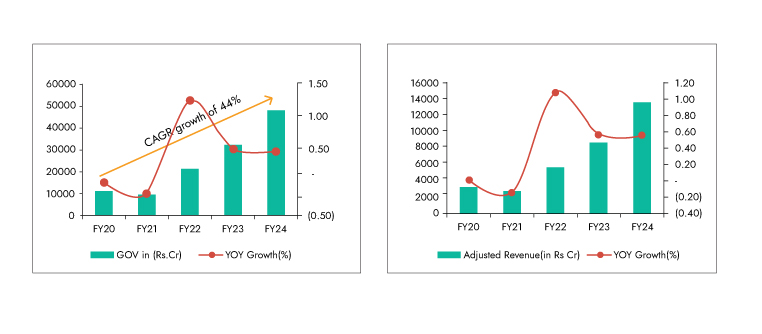
Source: Care Edge, Ambit Asset Management
3. TVS – From Challenger to Leader in EV
- TVS launched the i-Qube in January 2020, which has emerged as a game changer for the segment. Backed by continuous feature upgrades, varied battery pack options, and robust distribution expansion, the company achieved strong volume growth without compromising profitability. The key growth driver is the distribution enhancement the company has undertaken from 33 touchpoints in FY22 to ~900 touchpoints in FY25, driving accessibility and sales. The co. saw a market share growth from 2.1% in FY21 to 23% in Q4 FY25, making TVS the market leader in the e-2W segment.
The co. has positioned the product with multiple battery pack options, which can meet the requirements of different sets of buyers.
Exhibit 17: Bajaj and TVS are growing their 2W EV franchise Exhibit 18: Ather and Ola 2W EV volume trends
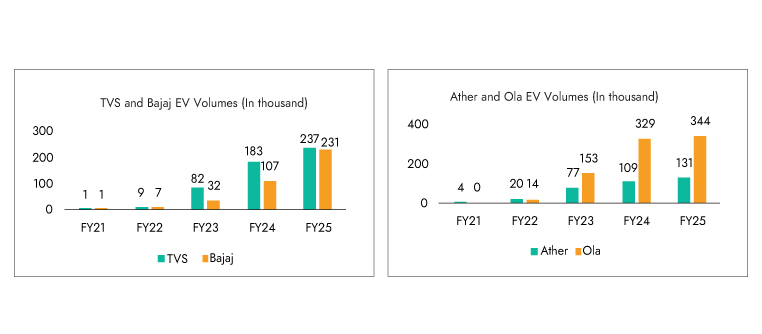
Source: Company, Ambit Asset Management
- Noteworthy is the fact that TVS has achieved positive contribution margins in contrast to most EV startups that continue to bleed, thereby demonstrating the strong R&D and manufacturing capabilities of the company. This is driven by economies of scale, better cost management and streamlining of operations.
- As EV subsidies shrink and access to PLI ceases to exist, the EV eco-system may struggle to stay competitive. TVS, with its superior product capabilities, scale-driven unit economics, and expanding market share, is well-positioned to lead India’s e-2W revolution.
4. Ice Make – Beneficiary of QC phenomena
Scalable Opportunity in Dark Stores and Q-Commerce: The rapid rise of Quick Commerce is transforming Indian retail, gradually replacing traditional kirana stores with dark stores. Dark stores are fulfillment centers designed for fast, online-only delivery of items ranging from groceries and perishables to electronics. These operations demand reliable, temperature-controlled environments, creating a strong tailwind for Ice Make’s refrigeration solutions. Having expanded into commercial freezers, Ice Make is now a key supplier to dark store ecosystems. The company currently generates ~INR 0.45 bn from this segment and targets scaling this to INR 2 bn over the next 3–4 years.
Exhibit 19: The presence of dark stores has increased rapidly over the past year
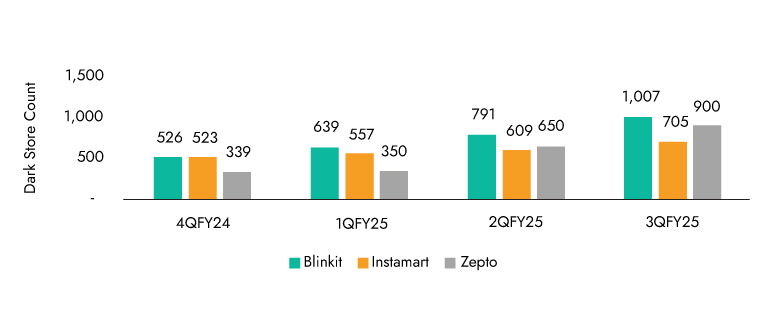
Source: Company, Ambit Asset Management
Backward Integration Through PUF Panels: Ice Make has recently ventured into manufacturing continuous PUF panels — insulated panels that offer superior thermal efficiency and are widely used in cold storage infrastructure. This segment has a revenue potential of INR 2.8 bn. Importantly, it complements Ice Make’s core business by enabling captive use in cold room products, which is one of the company’s key products. This move is expected to enhance margins and improve integration across the product portfolio.
Strong Capital Allocation and Balance Sheet Discipline: Ice Make has demonstrated consistent capital allocation discipline, which has helped maintain a robust balance sheet. Between FY17 and FY24, approximately 70% of its total capex was funded through operating cash flows — a strong indicator of financial prudence and internal accrual-driven growth. This approach underpins Ice Make’s ability to expand capacity without compromising financial health.
CONCLUSION
In today’s rapidly evolving business landscape, companies must continuously adapt and innovate to survive; those that fail to respond to disruptive forces risk obsolescence.
- Companies that proactively prepare for disruption, actively participate in transformative change, or strategically position themselves to gain from market upheaval consistently emerge as winners in today’s dynamic business environment. By fostering a culture of innovation, investing in new technologies, and adopting flexible business strategies, such companies can quickly pivot in response to emerging threats and opportunities.
- At Ambit Asset Management, we constantly look out for companies that are not only resilient in the face of disruption but are actively investing in new technologies, business models, and strategic initiatives to stay ahead. By identifying and investing in businesses that embrace change and leverage disruption as an opportunity, we position ourselves to benefit from the dynamic shifts shaping the future of the market.
- Ultimately, the ability to embrace and leverage disruption distinguishes market leaders from laggards, ensuring long-term success and sustaining competitive advantage.
AMBIT COFFEE CAN PORTFOLIO
At Coffee Can Portfolio, we do not attempt to time commodity/investment cycles or political outcomes and prefer resilient franchises in the retail and consumption-oriented sectors. The Coffee Can philosophy has an unwavering commitment to companies that have consistently sustained their competitive advantages in core businesses despite being faced with disruptions at regular intervals. As the industry evolves or is faced with disruptions, these competitive advantages enable such companies to grow their market shares and deliver long-term earnings growth.
Exhibit 20: Ambit’s Coffee Can Portfolio point-to-point performance
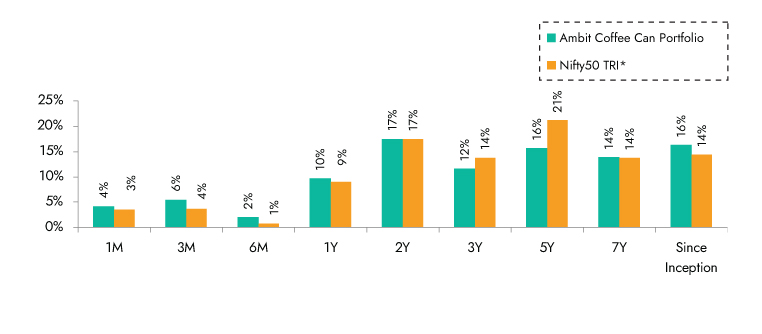
Source:Ambit Coffee Can Portfolio inception date is Mar 06, 2017**1M Return: 1st - 30th Ap'25; 3M Return: 1st Feb'25 – 30th Apr'25; 6M Return: 1st Nov'24 – 30th Apr'25; 1Y Return: 1st May'24 – 30th Apr'25 *Nifty 50 TRI is the selected benchmark for the Ambit Coffee Can Portfolio. The same is reported to SEBI
Exhibit 21: Ambit’s Coffee Can Portfolio calendar year performance
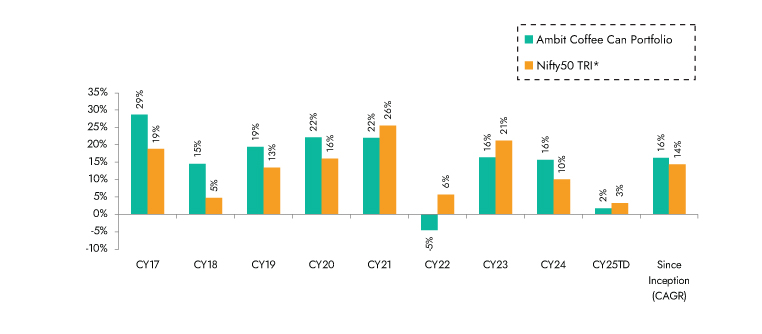
Ambit Coffee Can Portfolio inception date is Mar 06, 2017; *Nifty 50 TRI is the selected benchmark for the Ambit Coffee Can Portfolio. The same is reported to SEBI.
Ambit Good & Clean Midcap Portfolio
Ambit's Good & Clean strategy provides long-only equity exposure to Indian businesses that have an impeccable track record of clean accounting, good governance, and efficient capital allocation. Ambit’s proprietary ‘forensic accounting’ framework helps weed out firms with poor quality accounts, while our proprietary ‘greatness’ framework helps identify efficient capital allocators with a holistic approach for consistent growth. Our focus has been to deliver superior risk-adjusted returns with as much focus on lower portfolio drawdown as on return generation. Some salient features of the Good & Clean strategy are as follows:
- Process-oriented approach to investing: Typically starting at the largest 500 Indian companies, Ambit's proprietary frameworks for assessing accounting quality and efficacy of capital allocation help narrow down the investible universe to a much smaller subset. This shorter universe is then evaluated on bottom-up fundamentals to create a concentrated portfolio of no more than 20 companies at any time.
- Long-term horizon and low churn: Our holding horizons for investee companies are 3-5 years and even longer with annual churn not exceeding 20-25% in a year. The long-term orientation essentially means investing in companies that have the potential to sustainably compound earnings, with these compounding earnings acting as the primary driver of investment returns over long periods.
- Low drawdowns: The focus on clean accounting and governance, prudent capital allocation, and structural earnings compounding allow participation in long-term return generation while also ensuring low drawdowns in periods of equity market declines.
Exhibit 22: Ambit’s Good & Clean Midcap Portfolio point-to-point performance
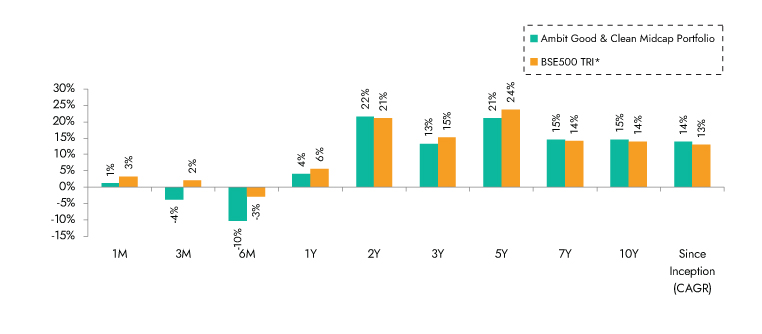
Source: Ambit Good & Clean Mid cap Portfolio inception date is Mar 12, 2015**1M Return: 1st - 30th Ap'25; 3M Return: 1st Feb'25 – 30th Apr'25; 6M Return: 1st Nov'24 – 30th Apr'25; 1Y Return: 1st May'24 – 30th Apr'25 *BSE 500 TRI is the selected benchmark for the Ambit Good & Clean Mid cap. The same is reported to SEBI.
Exhibit 23: Ambit’s Good & Clean Midcap Portfolio calendar year performance
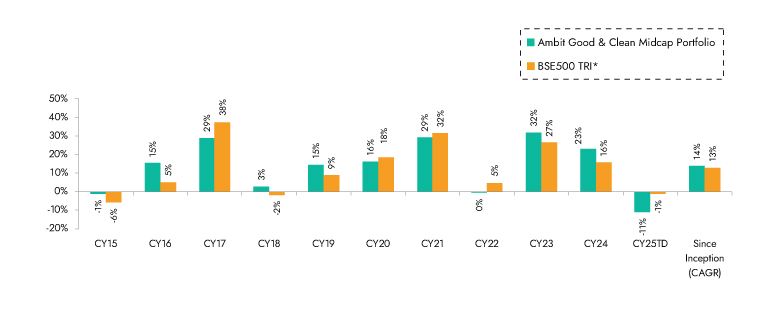
Ambit Good & Clean Mid cap Portfolio inception date is Mar 12, 2015; *BSE 500 50 TRI is the selected benchmark for the Ambit Good & Clean Mid cap. The same is reported to SEBI.
Ambit Emerging Giants Small Cap Portfolio
Small caps with secular growth, superior return ratios and no leverage are the essence of Ambit's Emerging Giants portfolio. The portfolio aims to invest in small-cap companies with market-dominating franchises and a track record of clean accounting, governance and capital allocation. The fund typically invests in companies with market caps less than INR 10,000 cr. These companies have excellent financial track records, superior underlying fundamentals (high RoCE, low debt), and the ability to deliver healthy earnings growth over long periods of time. However, given their smaller sizes, these companies are not well discovered, owing to lower institutional holdings and lower analyst coverage. Rigorous framework-based screening coupled with extensive bottom-up due diligence led us to a concentrated portfolio of 18-20 emerging giants.
Exhibit 24: Ambit Emerging Giants Portfolio point-to-point performance
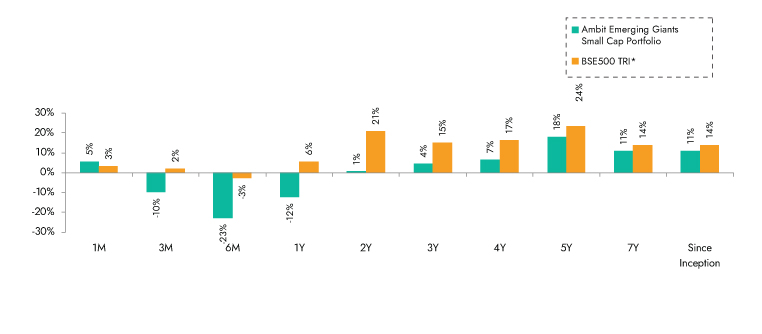
Source: Ambit Emerging Giants Small cap Portfolio inception date is Dec 1, 2017;**1M Return: 1st - 30th Ap'25; 3M Return: 1st Feb'25 – 30th Apr'25; 6M Return: 1st Nov'24 – 30th Apr'25; 1Y Return: 1st May'24 – 30th Apr'25 *BSE 500 TRI is the selected benchmark for the Ambit Emerging Giants Small cap. The same is reported to SEBI
Exhibit 25: Ambit Emerging Giants Portfolio calendar year performance
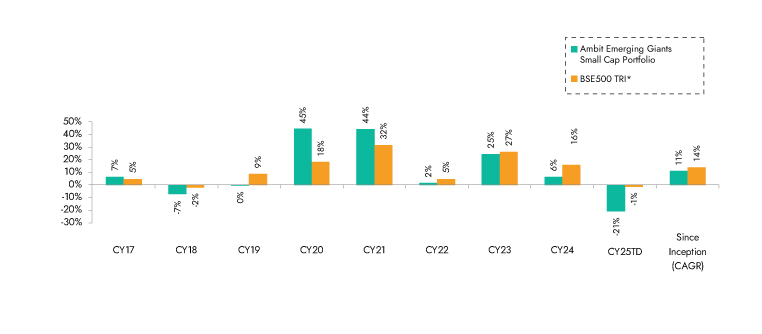
Source: Ambit Emerging Giants Small cap Portfolio inception date is Dec 1, 2017; *BSE 500 TRI is the selected benchmark for the Ambit Emerging Giants Small cap. The same is reported to SEBI.
Ambit TenX Portfolio
Ambit TenX Portfolio allows investors to participate in the India growth story as the Indian GDP heads towards a US $10 tn mark over the next 12-15 years. Medium and smaller corporates are expected to be the key beneficiaries of this growth. The portfolio intends to capitalize on this opportunity by identifying and investing in primarily mid & small cap companies that can grow their earnings 10x over the same period implying 18-21% CAGR.
Key features of this portfolio would be as follows:
- Longer-term approach with a concentrated portfolio: Ideal investment duration of more than five years with 15-20 stocks.
- Key driving factors: Low penetration, strong leadership and light balance sheet
- Forward-looking approach: Relying less on historical performance and more on future potential while not deviating away from the Good & Clean philosophy.
Exhibit 26: Ambit TenX Portfolio point-to-point performance
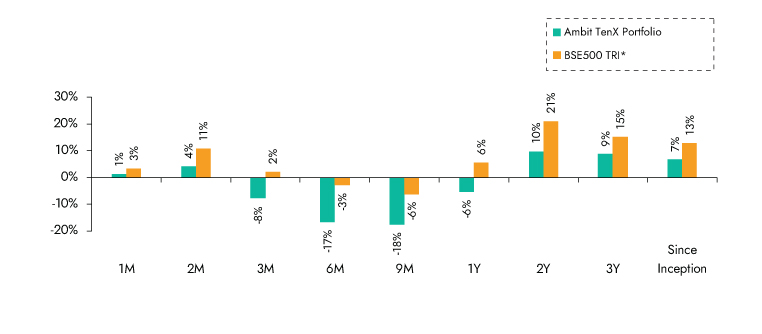
Source: Ambit TenX Portfolio inception date is Dec 13, 2021 **1M Return: 1st - 30th Ap'25; 3M Return: 1st Feb'25 – 30th Apr'25; 6M Return: 1st Nov'24 – 30th Apr'25; 1Y Return: 1st May'24 – 30th Apr'25 *BSE 500 TRI is the selected benchmark for the Ambit TenX Portfolio. The same is reported to SEBI
Exhibit 27: Ambit TenX Portfolio calendar year performance
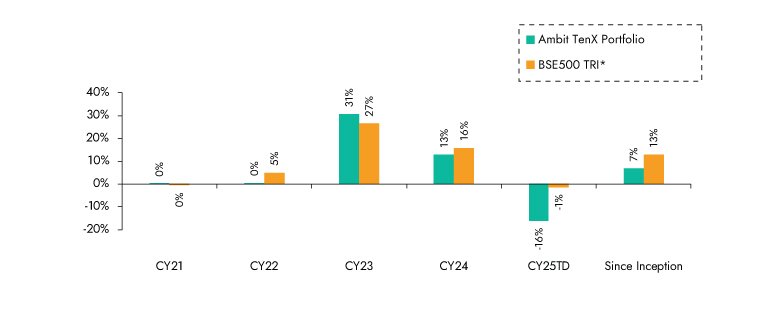
Source:Ambit TenX Portfolio inception date is Dec 13, 2021; *BSE 500 TRI is the selected benchmark for the Ambit TenX Portfolio. The same is reported to SEBI.
Ambit Micro Marvels Portfolio
We aim to create a portfolio that invests predominantly in micro-cap companies with the potential of delivering superior earnings growth and generating relatively better risk-adjusted performance over a long period of time.
Ambit’s proprietary ‘forensic accounting’ framework helps weed out firms with poor quality accounts while our proprietary ‘greatness’ framework helps identify efficient capital allocators. The result is a concentrated portfolio of 20-25 stocks that draws down less than the market in corrections and has low churn.
Key Features of Portfolio Companies:
1. High earnings growth companies with low leverage,
2. Market leaders or challengers with strong moat around brand, distribution, technology, and innovation,
3. Strong corporate governance coupled with apt capital allocation.
Exhibit 28: Ambit Micro Marvels Portfolio point to point performance
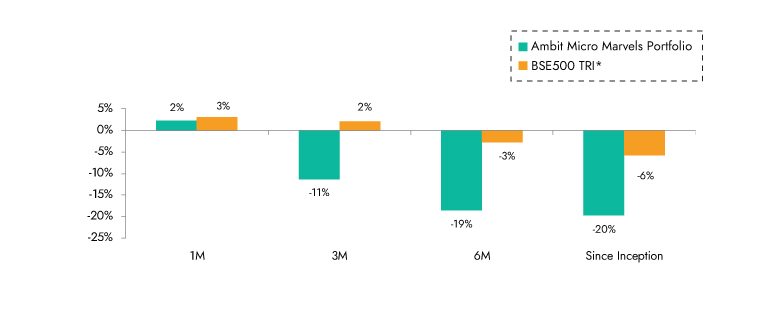
Source: Ambit Micro Marvels Portfolio inception date is Jul 29, 2024;**1M Return: 1st - 30th Ap'25; 3M Return: 1st Feb'25 – 30th Apr'25; 6M Return: 1st Nov'24 – 30th Apr'25; 1Y Return: 1st May'24 – 30th Apr'25 *BSE 500 TRI is the selected benchmark for the Ambit Micro Marvels Portfolio. The same is reported to SEBI.
Exhibit 29: Ambit Micro Marvels Portfolio point to point performance
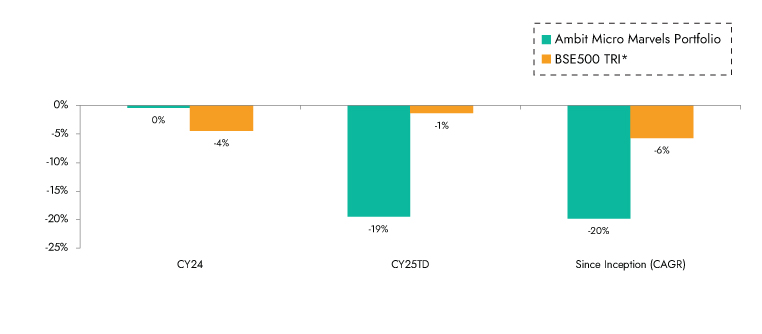
Source: Ambit Micro Marvels Portfolio inception date is Jul 29, 2024; *BSE 500 TRI is the selected benchmark for the Ambit Micro Marvels Portfolio. The same is reported to SEBI.